

Q9 & 10: Software support for servers
Q9/10. What best describes the support for open/closed source software running on your institution’s servers?
Support for open source software is less likely to be part of the job description of all ICT staff than support for closed source software. However, there is a large difference between HE and FE; open source software is much more likely to be supported without being part of staff job descriptions in FE than HE (36% vs 18%).
Overall, outsourced support for software on servers is also more common in FE, for both closed source and open source software.
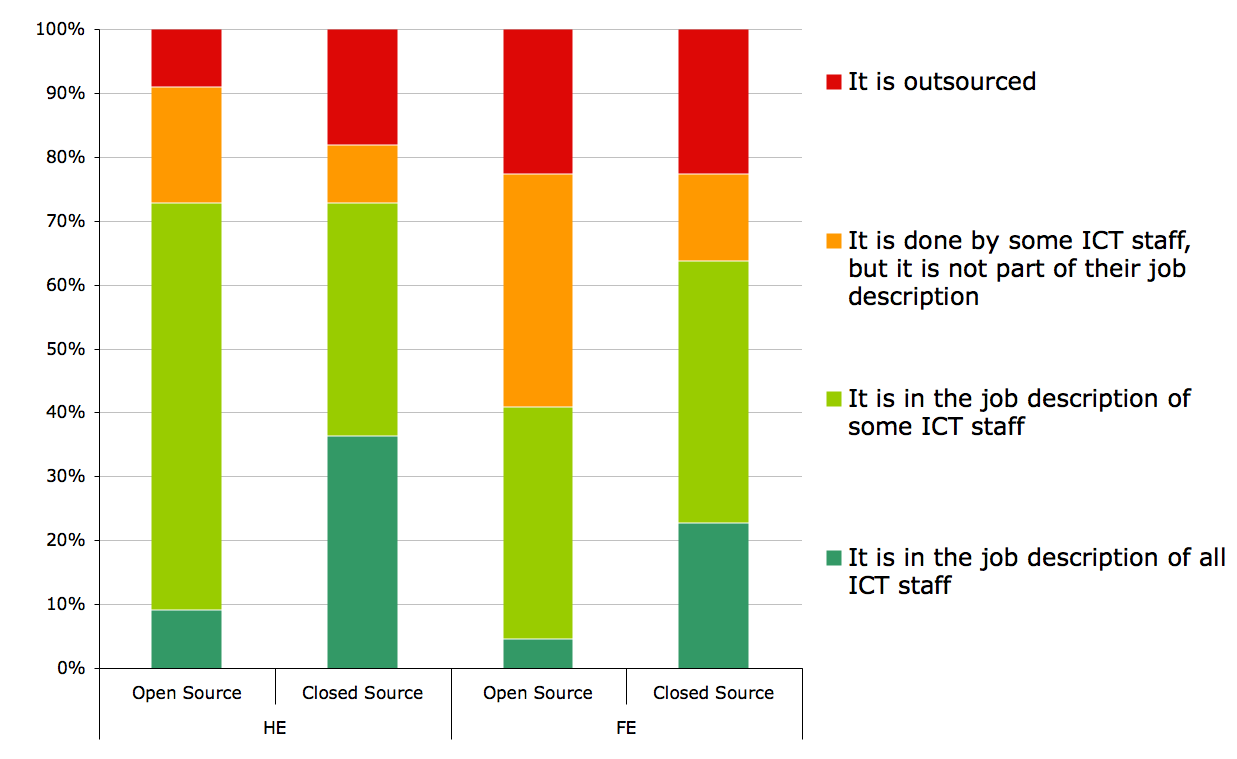
Figure 9a. Support for software on servers, comparing HE and FE
If we look at the trend from 2008-2013 just for support for open source software (Figure 9b), there is a more pronounced growth in outsourcing in FE, and a general shift towards less formalized support. By contrast, for HE the overall pattern is less clear.
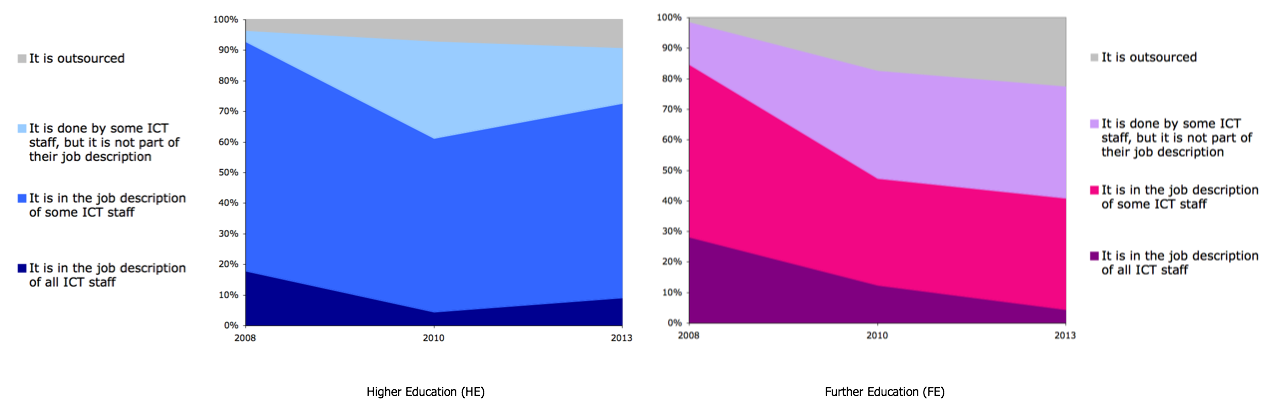
Figure 9b. Support for open source software on servers, comparing HE and FE 2008-2013
Q11: Ratio of open and closed source software deployed on servers
Q11. What is the approximate ratio of open and closed source software deployed on your servers? (in the past; currently; planned for the future)
There is a very clear cut difference between HE and FE sectors in responses to this question; FE institutions are predicting little change in the proportion of open source software on servers, and some institutions report a decline in the proportion of open source from the past.
However, the response from HE institutions indicates a strong movement from proprietary to open source software on servers, with half of the respondents predicting half-and-half open and closed source software in the future, and 13% predicting that most of the software running on servers to be open source in future.
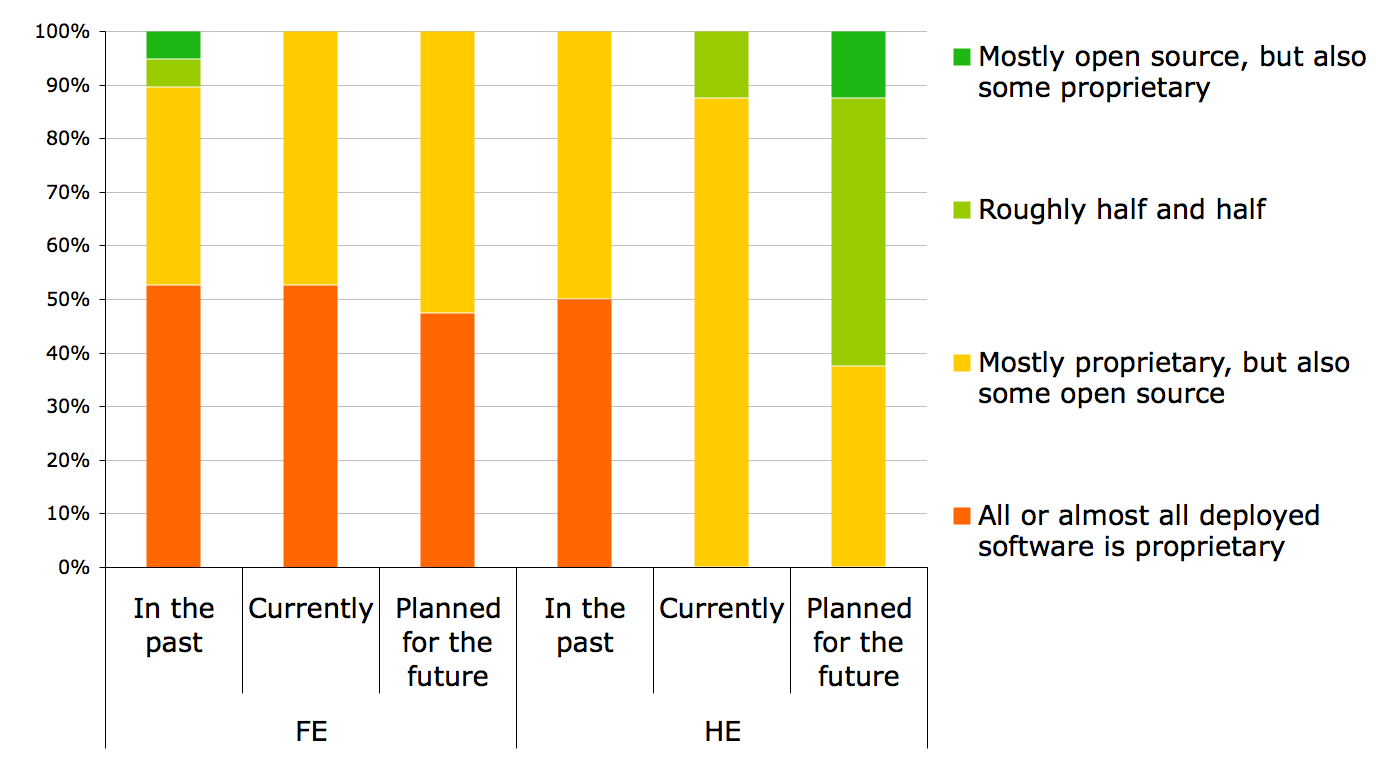
Figure 11a. Ratio of open and closed source software deployed on servers, comparing HE and FE
If we go back to the 2010 survey for HE, we can compare the future estimate then with the current state in 2013 (Figure 11b). While more respondents in 2010 predicted they would have “roughly half and half” open and closed source software than is reported in 2013, it is interesting that no HE institutions in 2013 reported they used all or almost all proprietary software.
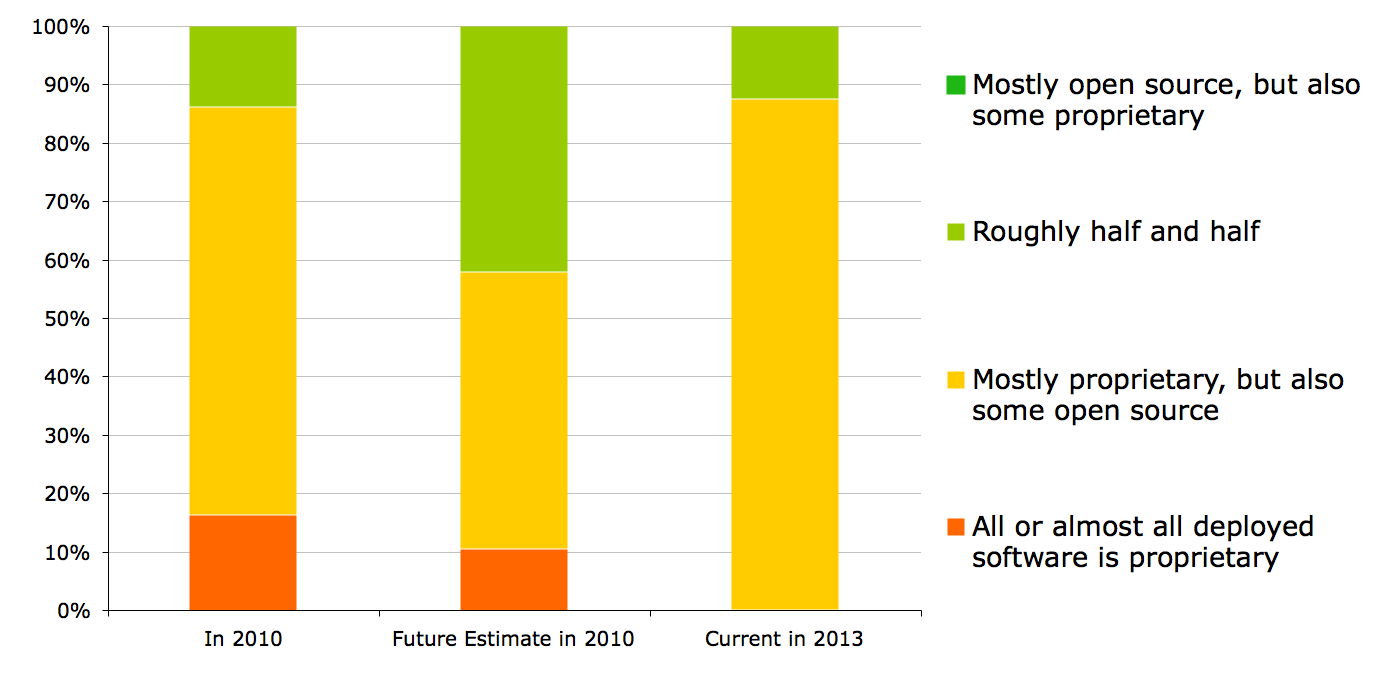
Figure 11b. Aspirations versus reality: server software in HE 2010-2013
For FE, however, the picture is very different (Figure 11c). Whereas institutions in 2010 were predicting they would use slightly more open source software in the future, the reality is that more institutions reported they used all or almost all closed source software.
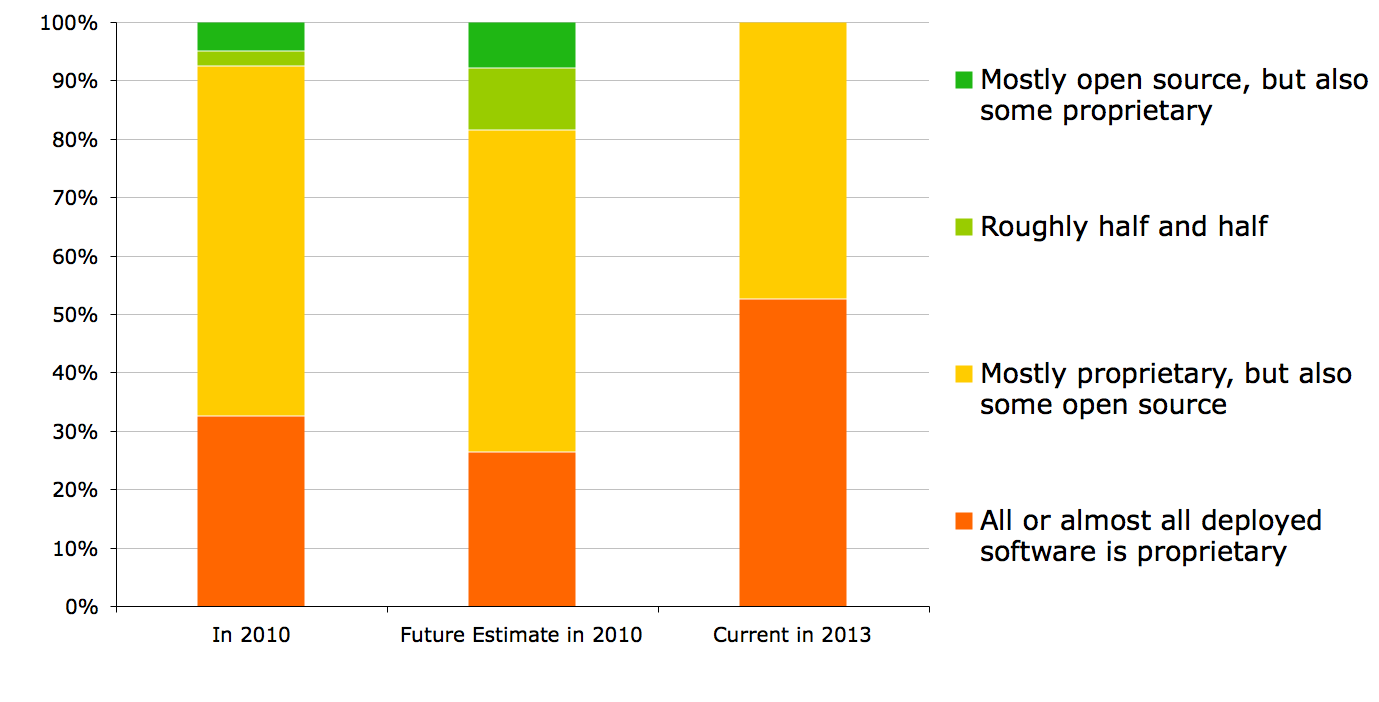
Figure 11c. Aspirations versus reality: server software in FE 2010-2013
Looking back over the past five years, there is a trend in HE towards a mix of open and closed source, with a decline in the number of institutions reporting that all or almost all software on their servers is closed source. This contrasts strongly with FE, where the trend is unclear, potentially indicating the use of closed source server software is increasing.
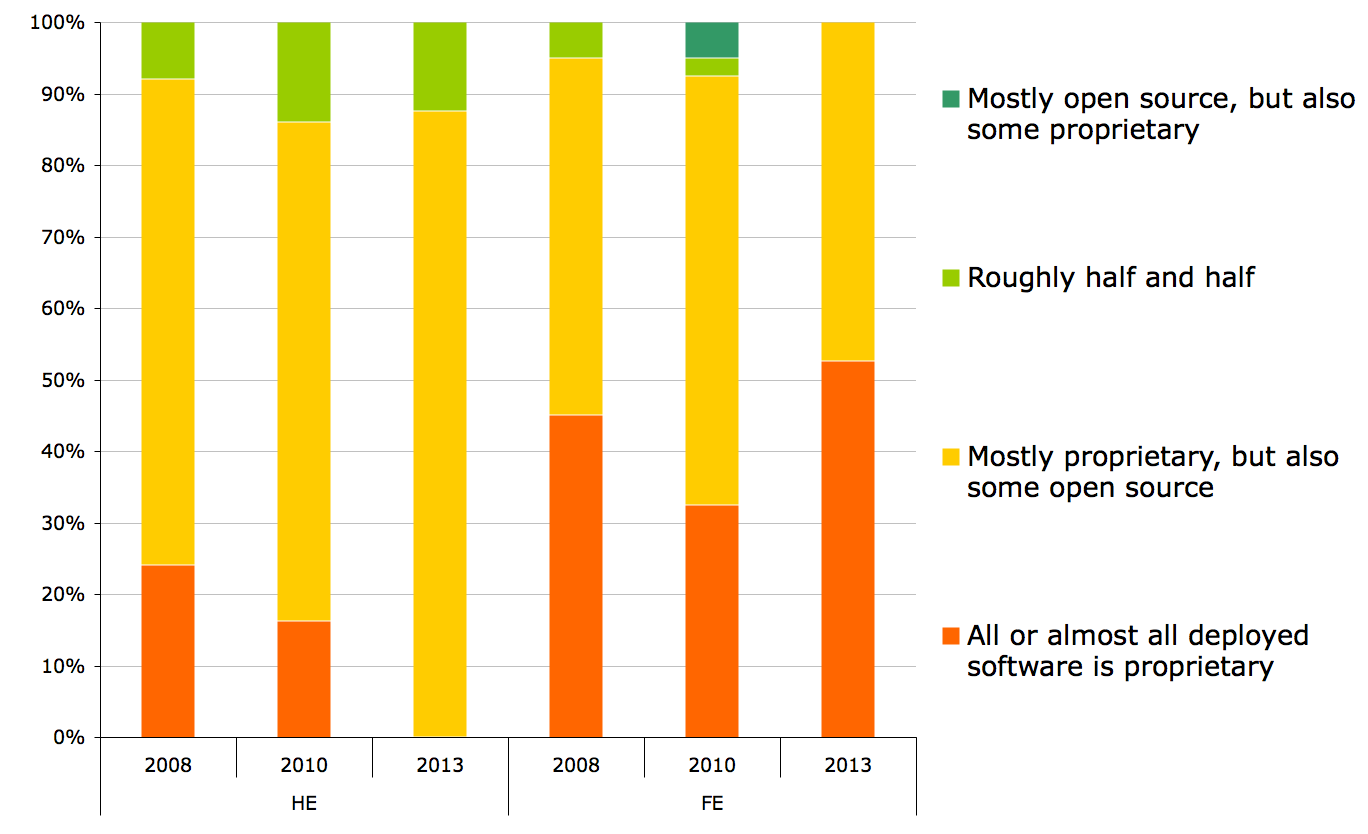
Figure 11d. Server software in FE and HE, 2008-2013
Q12-19 Software running on servers
Q12: Server operating systems
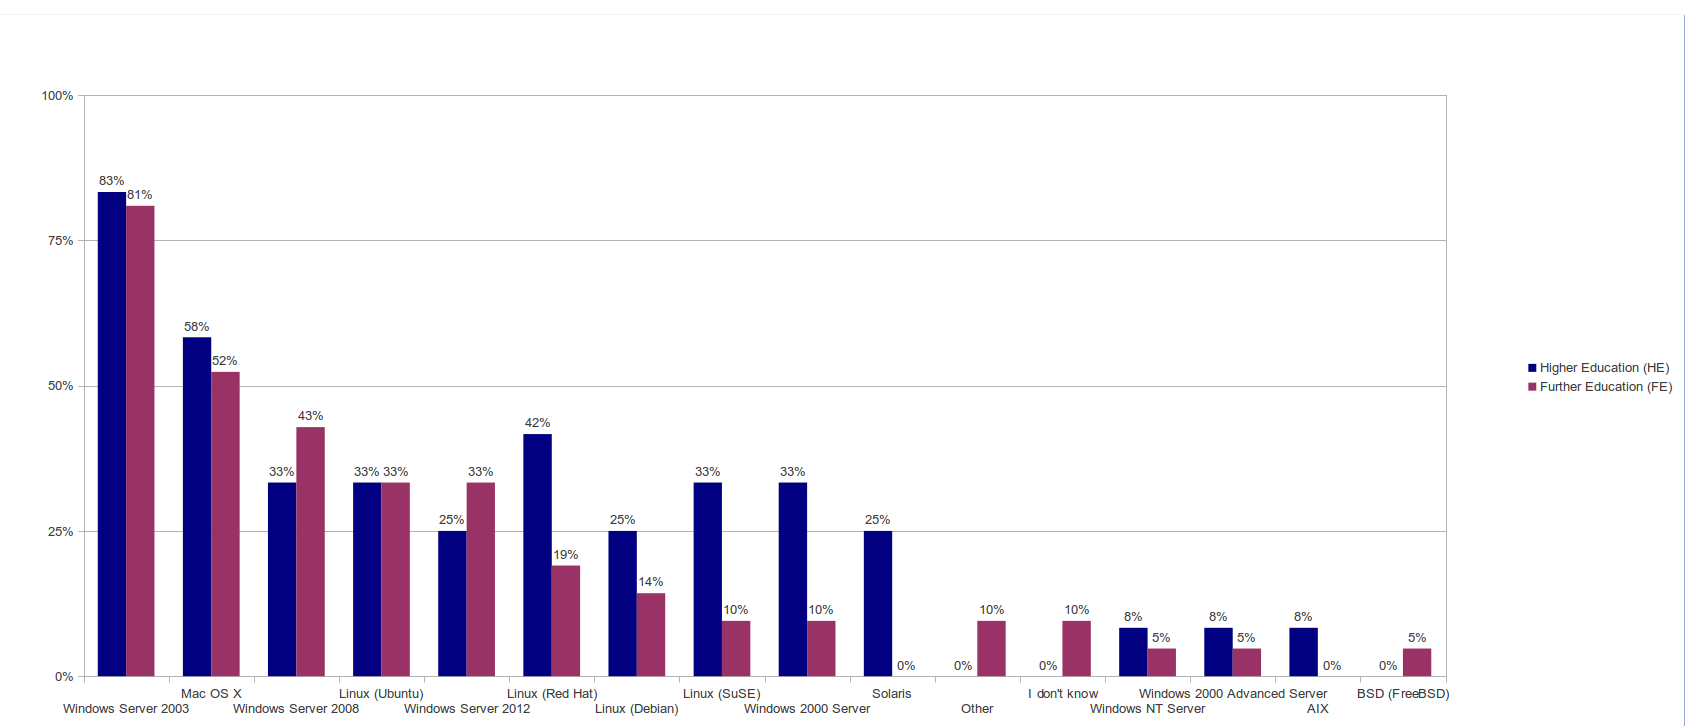
Q12. Which of the following operating systems are used on your institution’s servers?
Windows 2003 and Mac OSX remain the most popular server operating systems, with Windows Server 2008 and 2012 gaining a lot of usage since the 2010 survey, each now being deployed in around a third of insitutions. Linux (Ubuntu) and Linux (Debian) have grown in FE since 2010, from 25% to 33% and 10% to 14%, respectively. Linux (Debian) has also grown in HE to 25%, up from 14% in 2010.
Q13: Mail servers
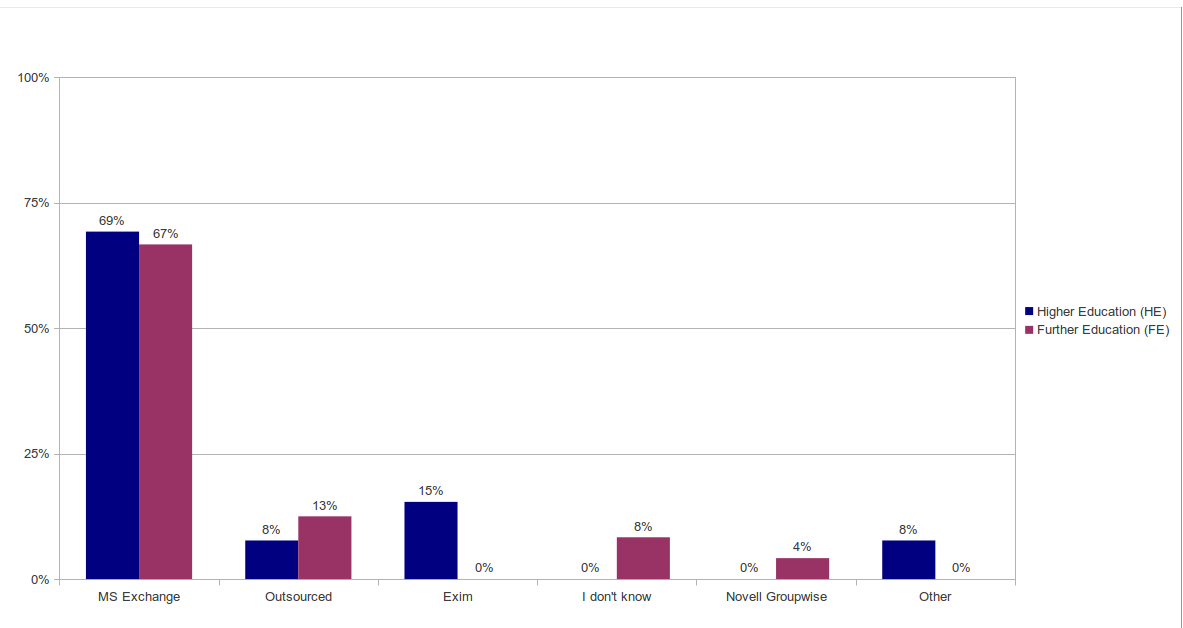
Q13. Which of the following mail servers are used at your institution?
As in 2008 and 2010, MS Exchange is still the most popular mail server by a large margin. Novell Groupwise has dropped from 18% to 4% of HE institutions since 2010, and from 7% to 0% of FE. The open source Exim server has also dropped from 25% to 15% in HE. Outsourced solutions have seen an increase in FE from 0% to 13%, while decreasing in HE from 14% to 8%.
Q14: Webmail systems
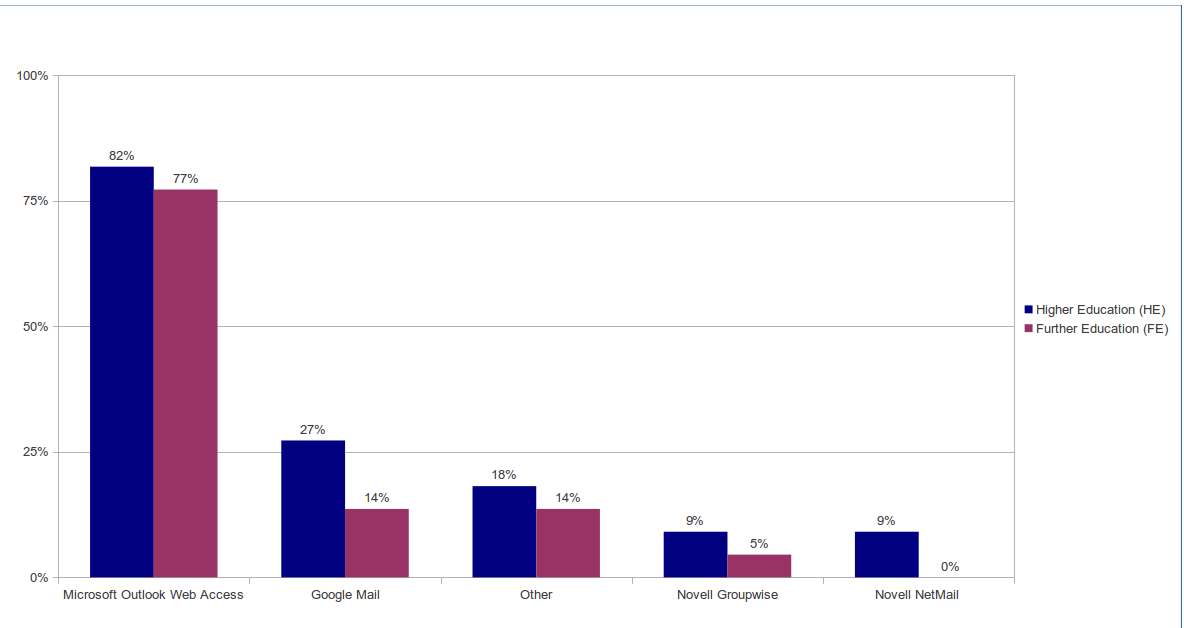
Q14. Which of the following webmail systems are used in your institution?
Microsoft Outlook Web Access remains the leading solution in both HE and FE. Usage of Novell Groupwise Webmail has dropped in line with the drop in server usage in FE to 5% (18% in 2010). Usage of Google Mail has increased to 14% in FE (5% in 2010) and 27% in HE (16% in 2010).
Q15 Database servers
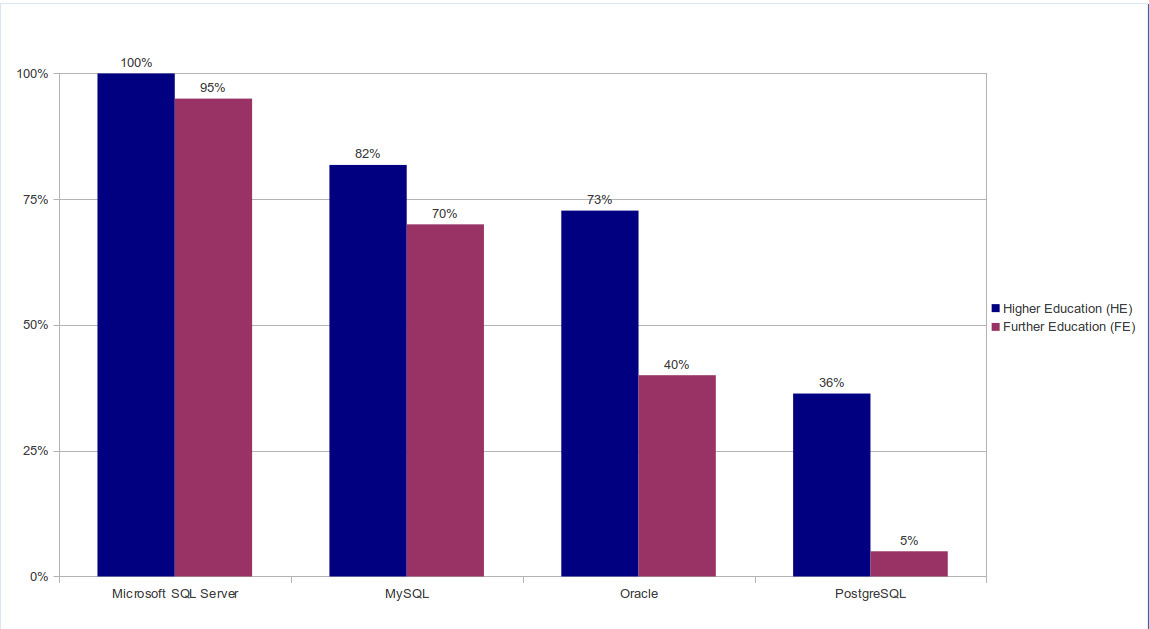
Q15. Which of the following database servers are used in your institution?
Microsoft SQL Server remains the most widely deployed database server, being found in almost all institutions. MySQL’s deployment remains stable at its 2010 levels, in 70% of FE and 82% of HE institutions. Oracle has decreased in FE to 40% (66% in 2010) while increasing in HE to 73% (60% in 2010). PostgreSQL has increased slightly in FE to 5% (3% in 2010), and significantly in HE to 36% (9% in 2010).
Q15. Which of the following database servers are used in your institution?
Q16: Virtual Learning Environments (VLEs)
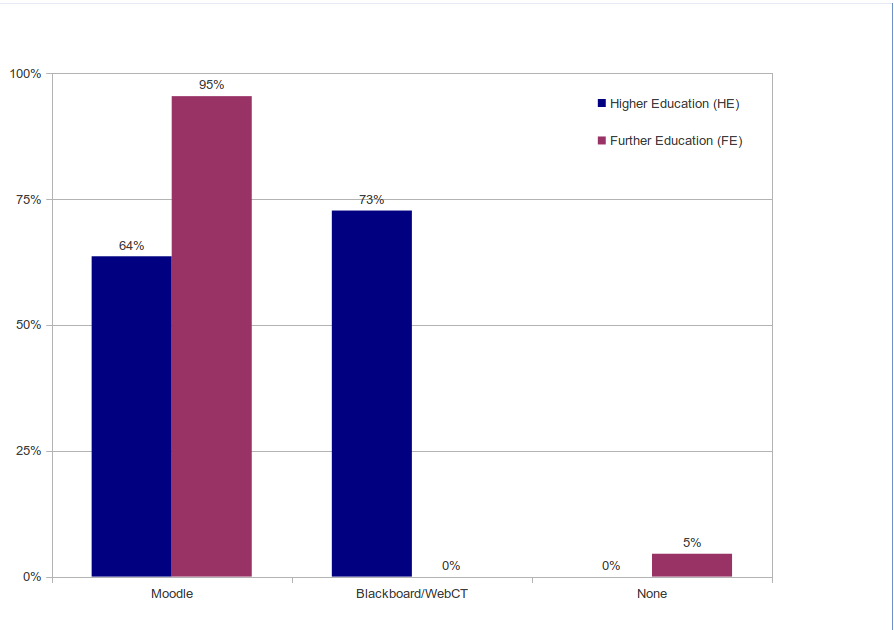
Q16. Which of the following Virtual Learning Environments (VLEs) are used in your institution?
Open source solutions continue to be widely adopted in the VLE market. Moodle continues to be the most popular VLE, increasing to 95% of FE insitutions (83% in 2010) and 65% of HE (59% in 2010). Blackboard/WebCT has increased slightly in HE to 73% (59% in 2010), while reducing from 20% to 0% of FE institions. Only 5% of FE insitutions used no VLE.
Q17 Content Management Systems (CMSs)
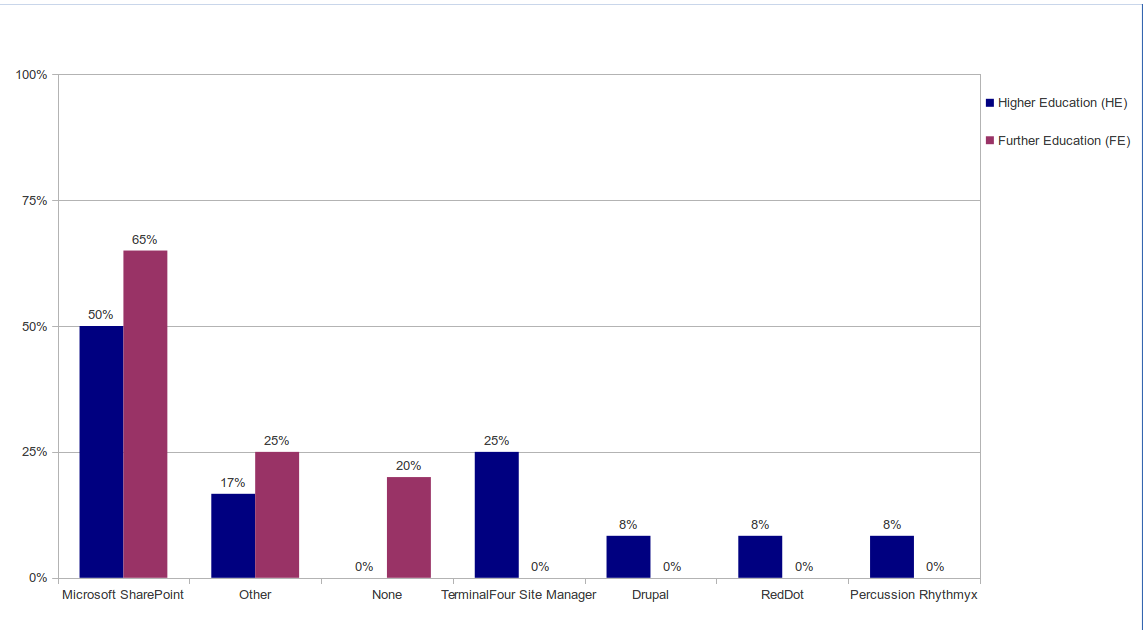
Q17. Which of the following Content Management Systems (CMSs) are used in your institution?
The percentage of institutions using no CMS has decreased dramatically from 43% to 20% in FE, and from 11% to 0% in HE. Usage of Sharepoint has increased to 50% of HE (36% in 2010) and 65% of FE (43% in 2010). There was a much narrower range of responses compared to 2010.
Q18 Directory Service Systems
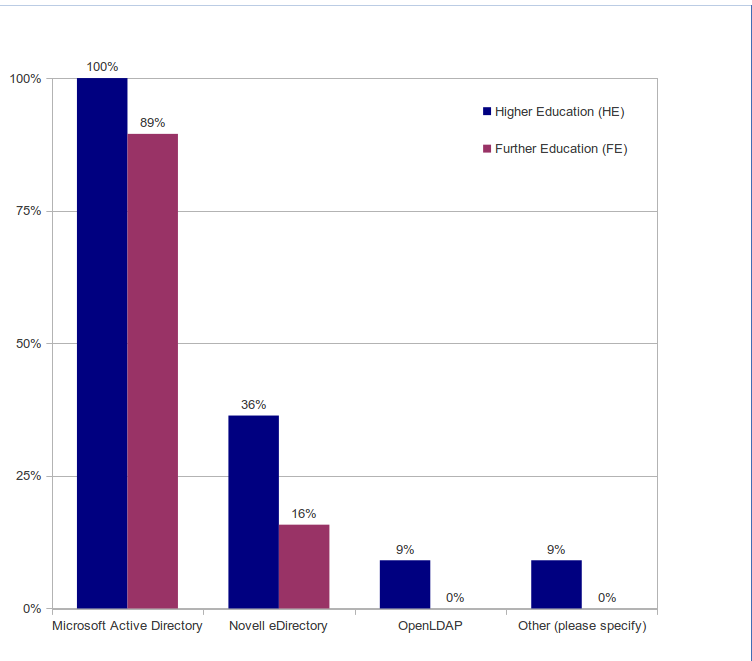
Q18. Which of the following Directory Service systems are used in your institution?
Microsoft Active Directory remains the most widely used Directory Service, deployed in almost all institutions, while Novell eDirectory retains a fairly stable share of the market. OpenLDAP usage has almost completely diminished, to 0% in FE (8% in 2010) and 9% in HE (21% in 2010).
Q19 Other server software
Q19. Which software, if any, does your institution use in the following areas? Please only consider centrally-supported services rather than applications deployed for purely local use (e.g. department, research group or individuals).
In this question respondents were asked to indicate any software (or multiple software solutions) they may use in a number of areas. No prompts were provided and the answers were free-text. The resulting quantitative data was obtained by sorting the free-text responses into categories according to content. Where multiple software solutions were indicated, each was counted as a response in its own right.
- Calendar/diary services: Microsoft Exchange remains the most popular solution, although a few insitutions used Google Calendar.
- Wikis: Of the insitutions to report using a wiki, Blackboard, Campus Pack and MS Sharepoint were the most popular solutions, with Atlassian Confluence, Moodle, Joomla and IBM Connections also being used.
- Blogs: Wordpress was the most popular solution, used in 44% of institutions. 17% of insitutions used Sharepoint for blogging, while other solutions included Moodle, Blackboard and Blogger.
- Project Management software: All instutitions who reported using project management software used Microsoft Project.
- Social Networking software: Facebook was the most widely used social network, used by 33% of institutions, while Twitter was used in 24%, both seeing an increase in usage since 2010.
- Groupware: Microsoft products (SharePoint and Exchange) remain the most popular solutions.
- Digital repositories: Responses included a range of systems including Sharepoint, DSpace, Planet EStream, ePrints and Equella.
Q20: Criteria when procuring software for servers
Q20. Rank the top 5 criteria that your institution considers important when procuring software for your servers, from most to least important. Please number 5 of the boxes, 1 being the highest priority
For higher education, the most important criteria when procuring server software are meeting user expectations, and total cost of ownership, with a weighted score of 37 and 29 respectively. These two factors are consistently ranked higher than the next 8 criteria, which form the next significant cluster, ranging from a weighted score of 18 points (interoperability) to 7 points (upgrade costs).
Note: scores are weighted so that highest-priority selections are given 5 points, the lowest 1 point. In the figures, this weighted total is used to rank the results, however individual responses are shown in the bars
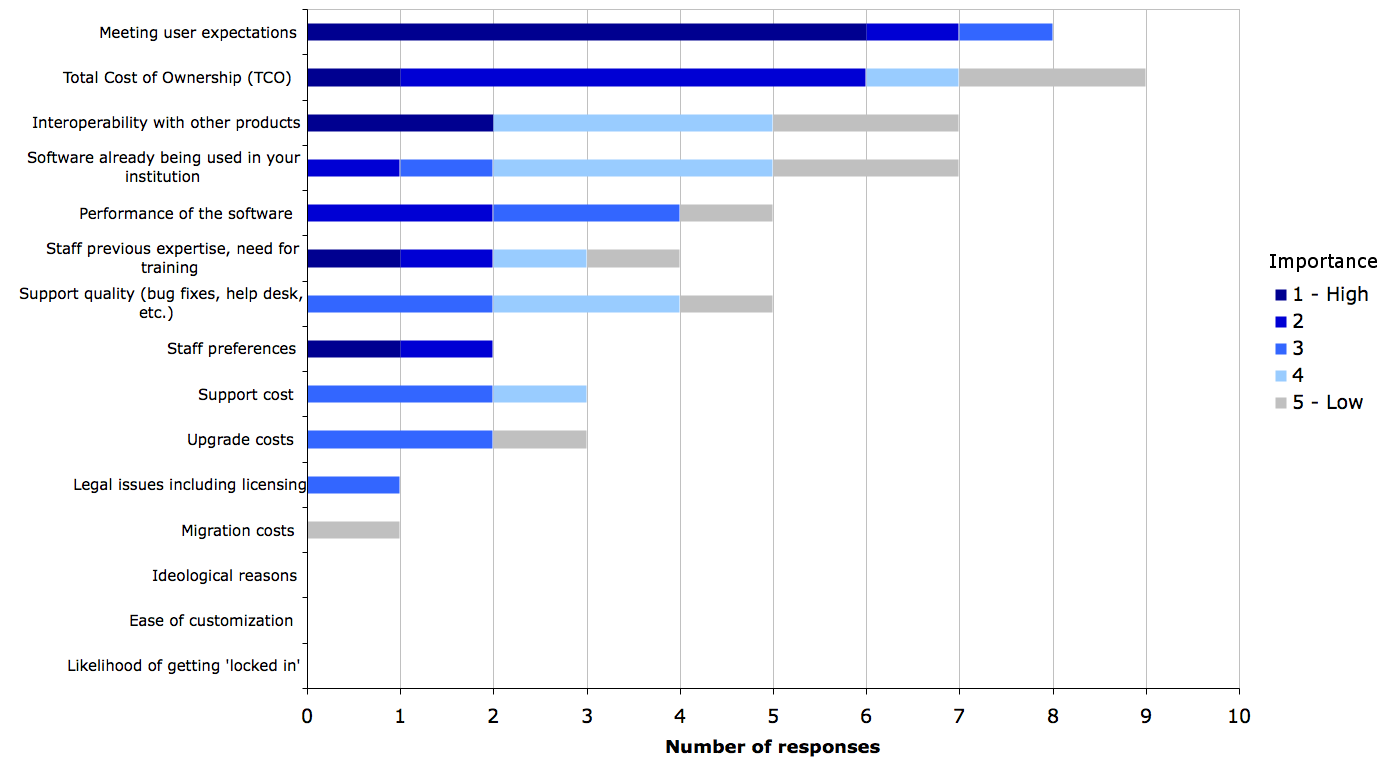
Figure 20a. Key factors in server software procurement in HE
When we look at FE, however, our survey found that performance of the software was the most highly ranked criterion (with 60 weighted points), followed by meeting user expectations (44 points) and total cost of ownership (36 points). In the next group are interoperability (32), support quality (29), support cost (27), sotware already in use (27) and staff previous experience (21).
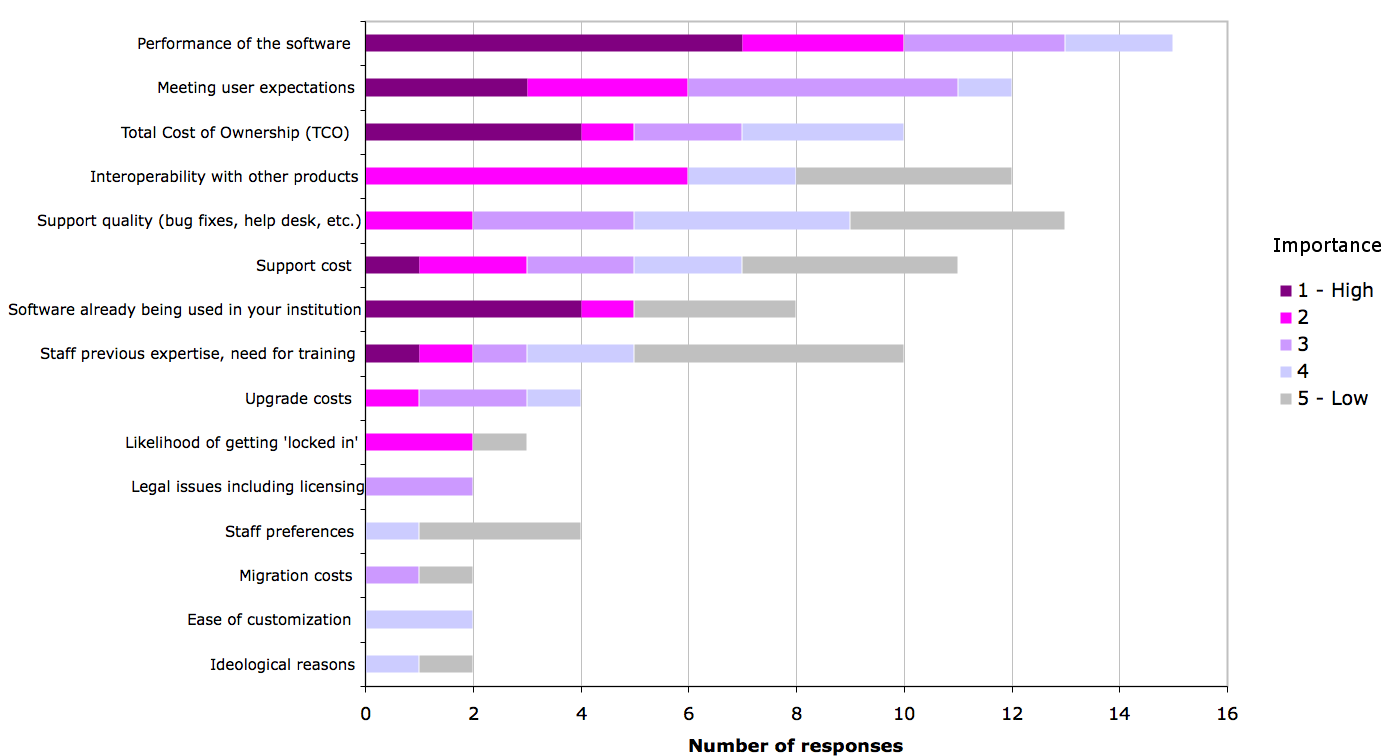
Figure 20b. Key factors in server software procurement in FE
Putting together both HE and FE, the top criteria are meeting user expectations, performance of the software, total cost of ownership, and interoperability. This is consistent with both the 2010 and 2008 surveys.
Again, lock-in and migration costs are not ranked as a concern by respondents, while interoperability is in the top four; in previous surveys we have interpreted this as indicating that insitutions will often see achieving interoperability as the same thing as buying from the same vendor, and do not have a strong culture of planning software exit strategies.
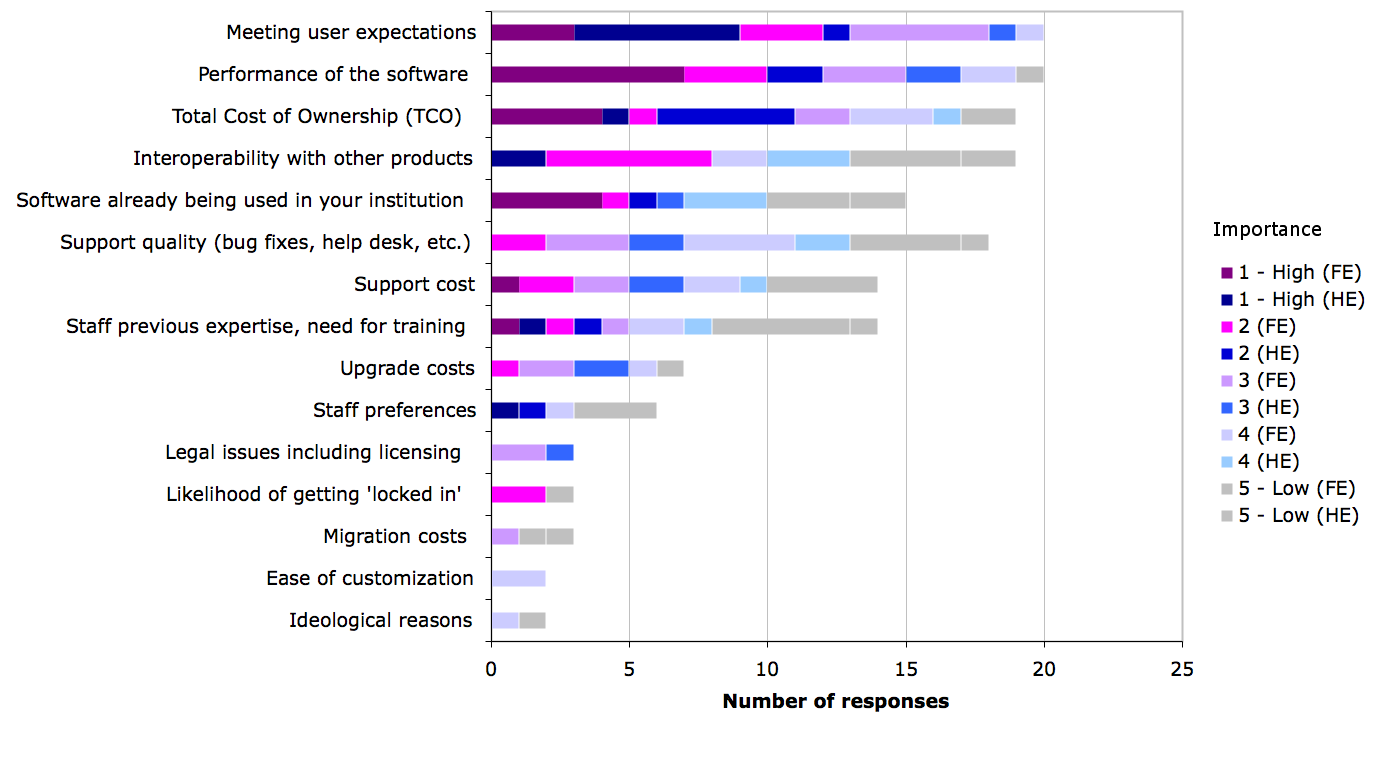
Figure 20c. Key factors in server software procurement in both HE and FE
Q21: Software considered for procurement/replacement on servers
Q21. Which new server software systems are currently being considered for procurement at your institution? Please also include old systems being considered for replacement. This could be, for example, because your institution does not have some systems, but would like to procure them, or because your current systems do not meet your needs.
Overall levels of replacement and procurement are slightly lower than in 2010, with only a few categories showing even very modest increases.
The largest drops in planned procurement and replacement are for mail servers in FE (down from 31% to 9%), VLEs in HE (down from 43% to 12%), content management in HE (down from 49% to 29%), directory services in FE (down from 20% to 0%) and digital repositores in HE (down from 26% to 12%).
The only increases are in VLEs in FE (up from 11% to 19%), content management in FE (up from 20% to 25%), and blog software in both FE and HE (up to 6% and 12% from 3% and 9% respectively).
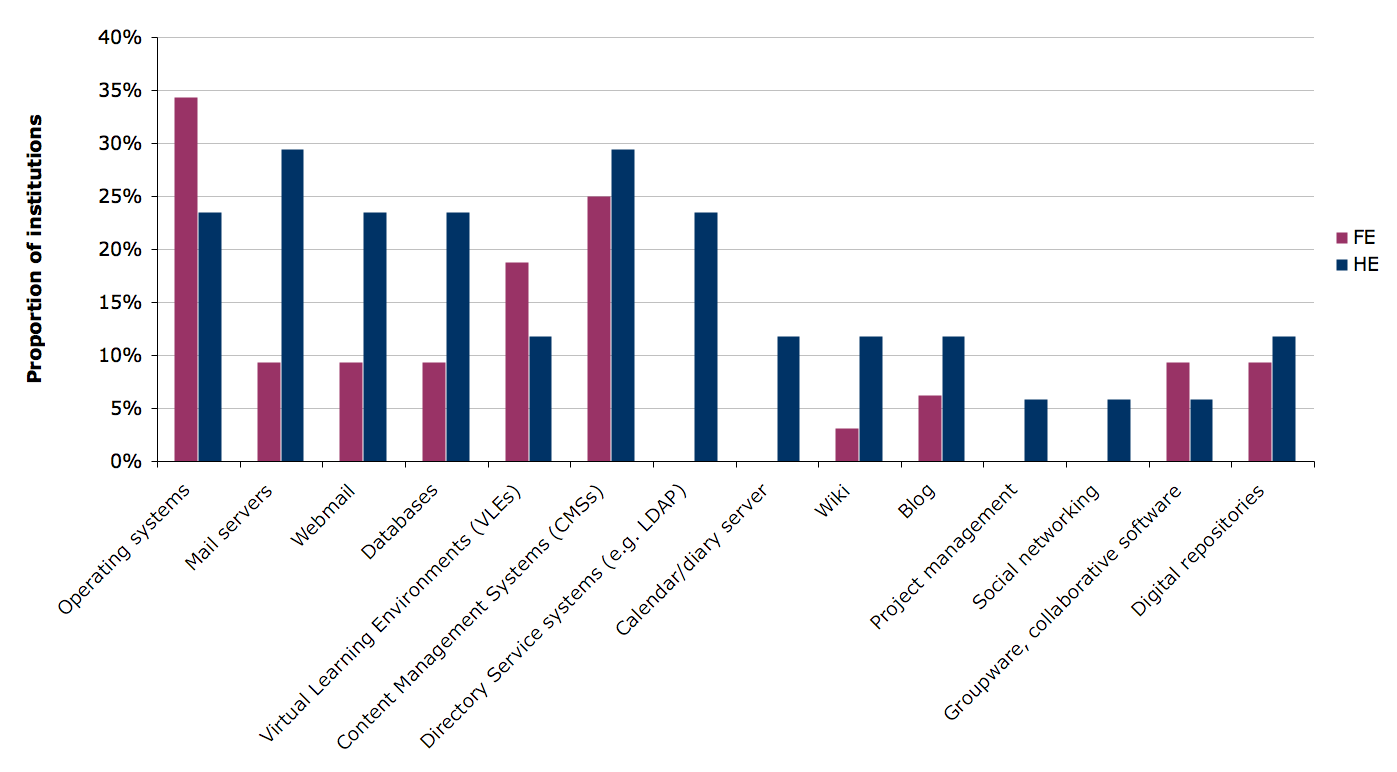
Figure 21. Server software being considered for procurement in both HE and FE
Q22: Reasons to decide against using open source software on servers
Q22. If your institution decides against using an open source software system on its servers, what are the top 5 most likely reasons? Please rank the following reasons from most to least likely.
Note: scores are weighted so that highest-priority selections are given 5 points, the lowest 1 point. In the figures, this weighted total is used to rank the results, however individual responses are shown in the bars
The most important reasons for deciding against using open source for server software in HE are interoperability and migration problems, followed by not being what users want. (Note in Q20 both interoperability and meeting user expectations are highly placed as selection criteria.)
Perhaps more importantly, lack of support has dropped from being the number one ranked reason in the 2010 survey, to fifth place in 2013.
The interoperability and migration issue is a difficult one, and we suspect this is may have its roots in lock-in to existing systems rather than interoperability problems with open source solutions.
Lack of expertise is reported as less important in 2013 than in our 2010 survey, although the perception of open source software as being of poor quality is ranked similarly.
The most surprising addition to the top five reasons is “there is no open source solution for our needs”. Given that there are open source options for almost all kinds of software in use in education, this is hard to take at face value. Perhaps this obscures a different reason, such as open source options not being considered during procurement (i.e., a post-hoc rationalisation).
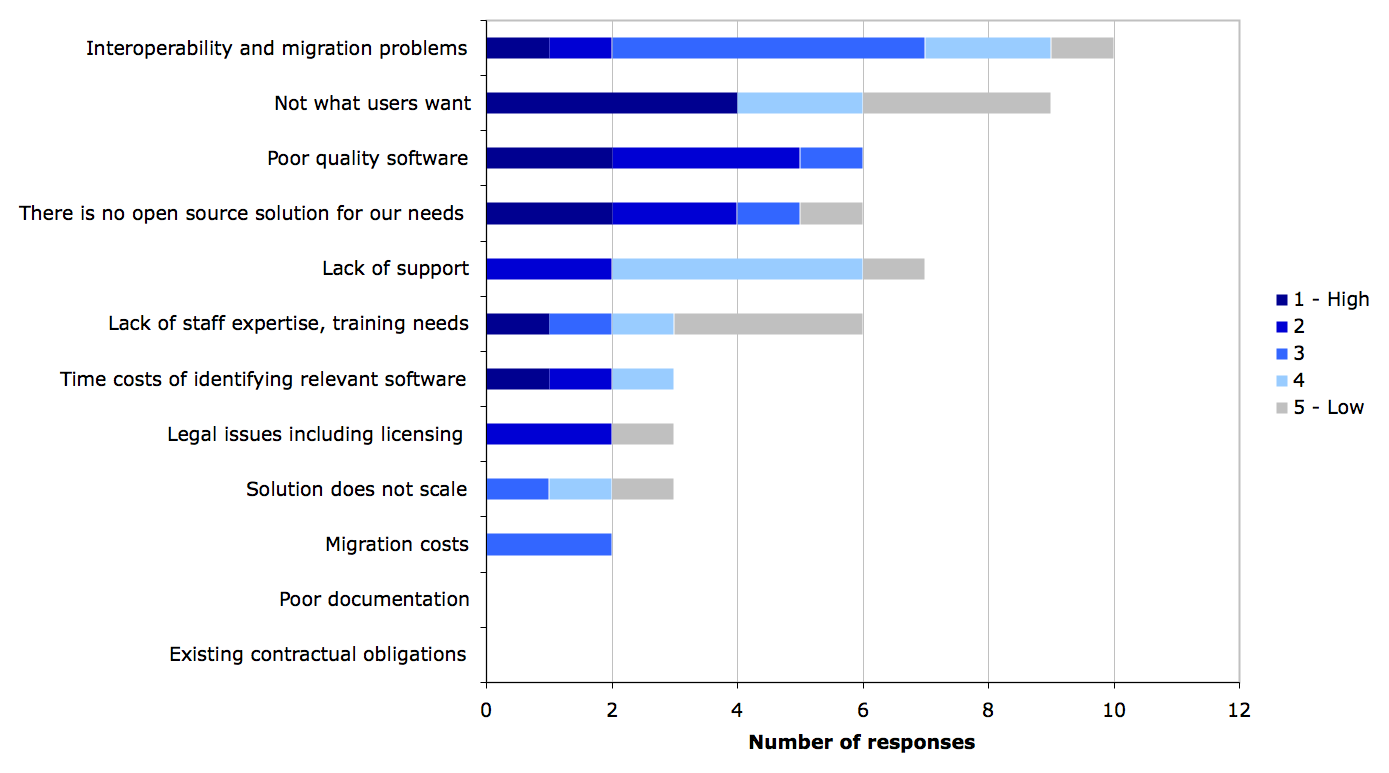
Figure 22a. Reasons to decide against using open source software on servers: HE
Interoperability and migration issues were important for FE respondents also, but were just eclipsed by lack of support. Lack of staff expertise is also in the top three reasons for FE.
Another interesting point is legal and licensing issues receiving a higher than expected rating in FE.
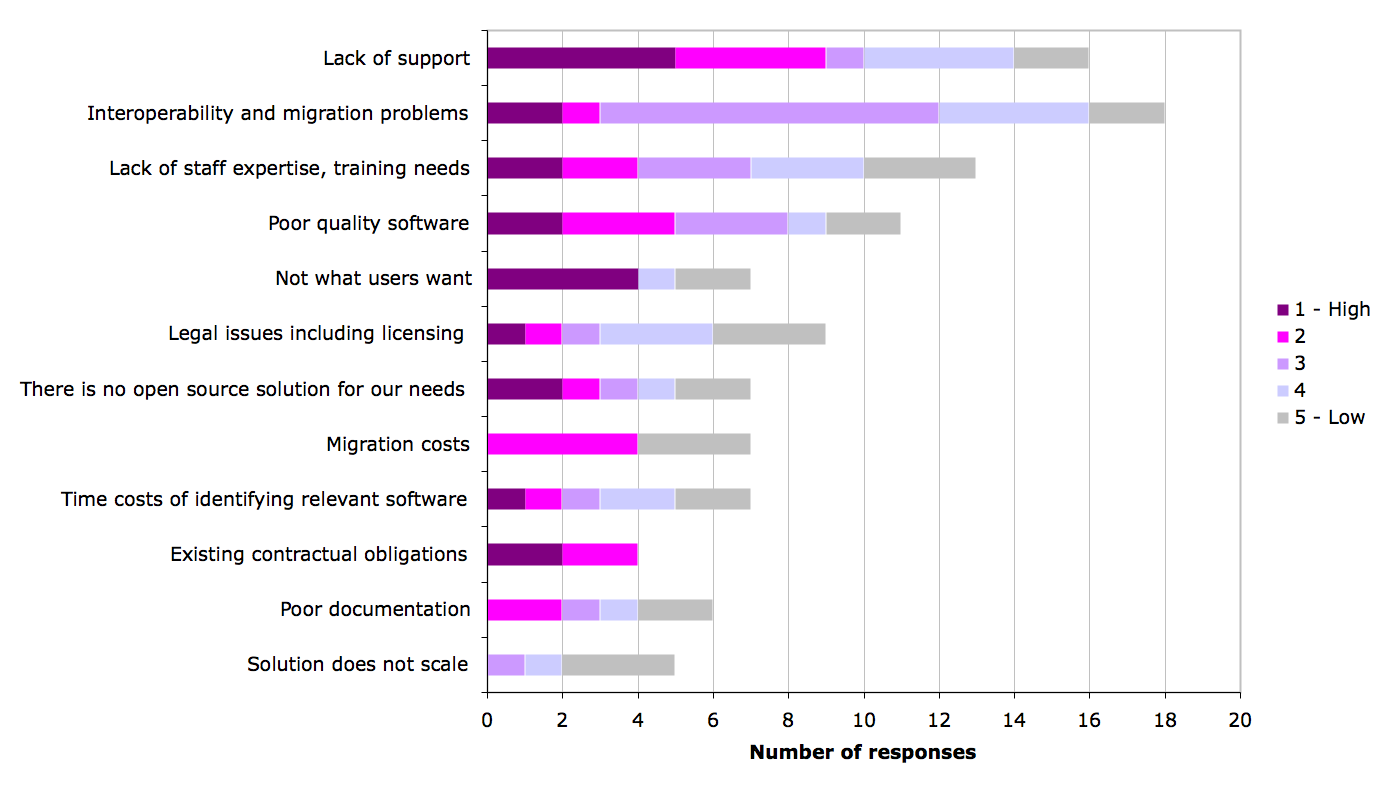
Figure 22b. Reasons to decide against using open source software on servers: FE
Combining the results for both FE and HE, interoperability and migration is the top issue by a significant margin (80 weighted points), followed by lack of support (71 points), poor quality (60 points), not what users want (51 points), lack of staff expertise (49 points) and “no open source solution meets our needs” (43 points). All other considerations ranked less than 30 points.
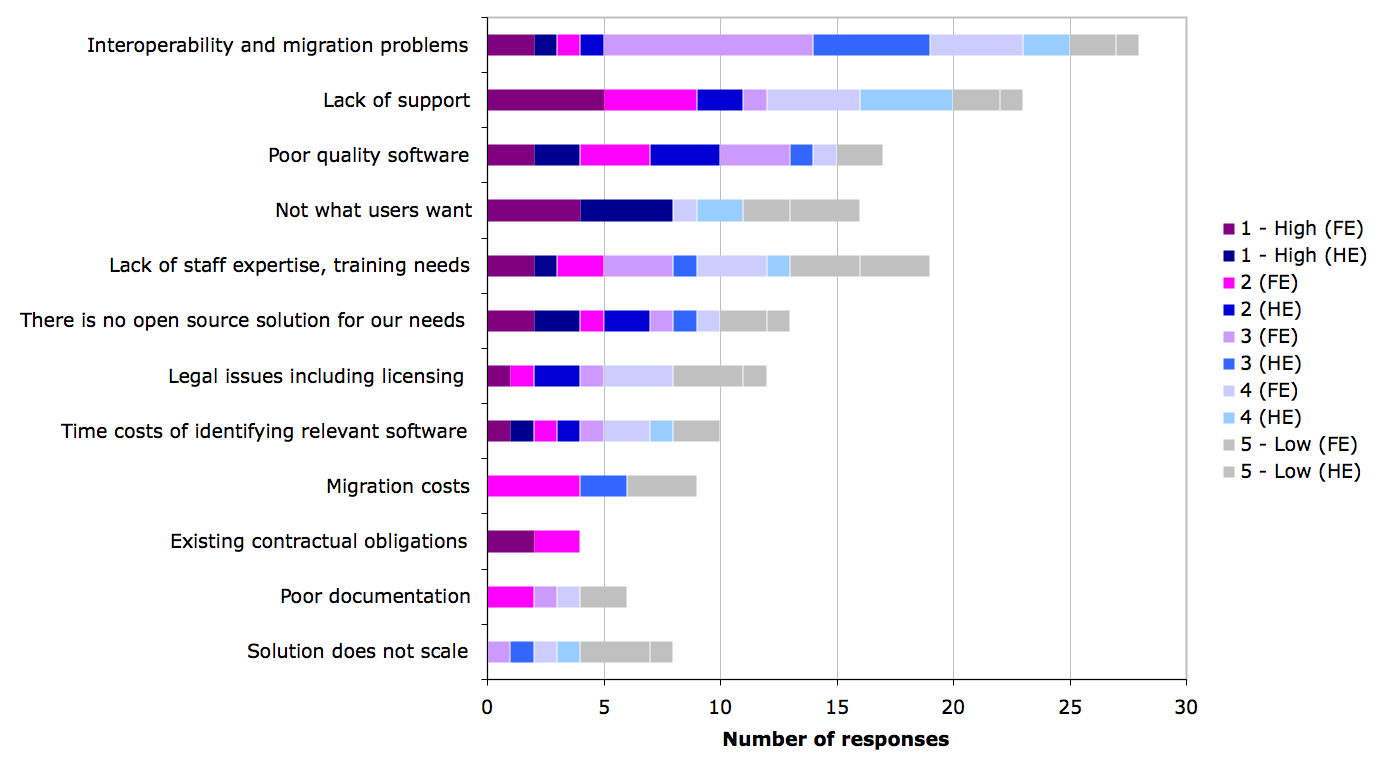
Figure 22c. Reasons to decide against using open source software on servers in both HE and FE
Previous section: Staff contributions to open source software
Next section: Software running on desktops