

Q4: Institutional ICT Policies
Q4: What best describes your institution in terms of ICT-related policies?
The responses to Q4 largely repeat the pattern of the corresponding question in the 2010 and 2008 survey (see Figure 4), with most institutions having an official ICT policy (74%), with a minority of institutions having ICT policies spread across other policies (24%). A very small number had no known ICT policy (3%).
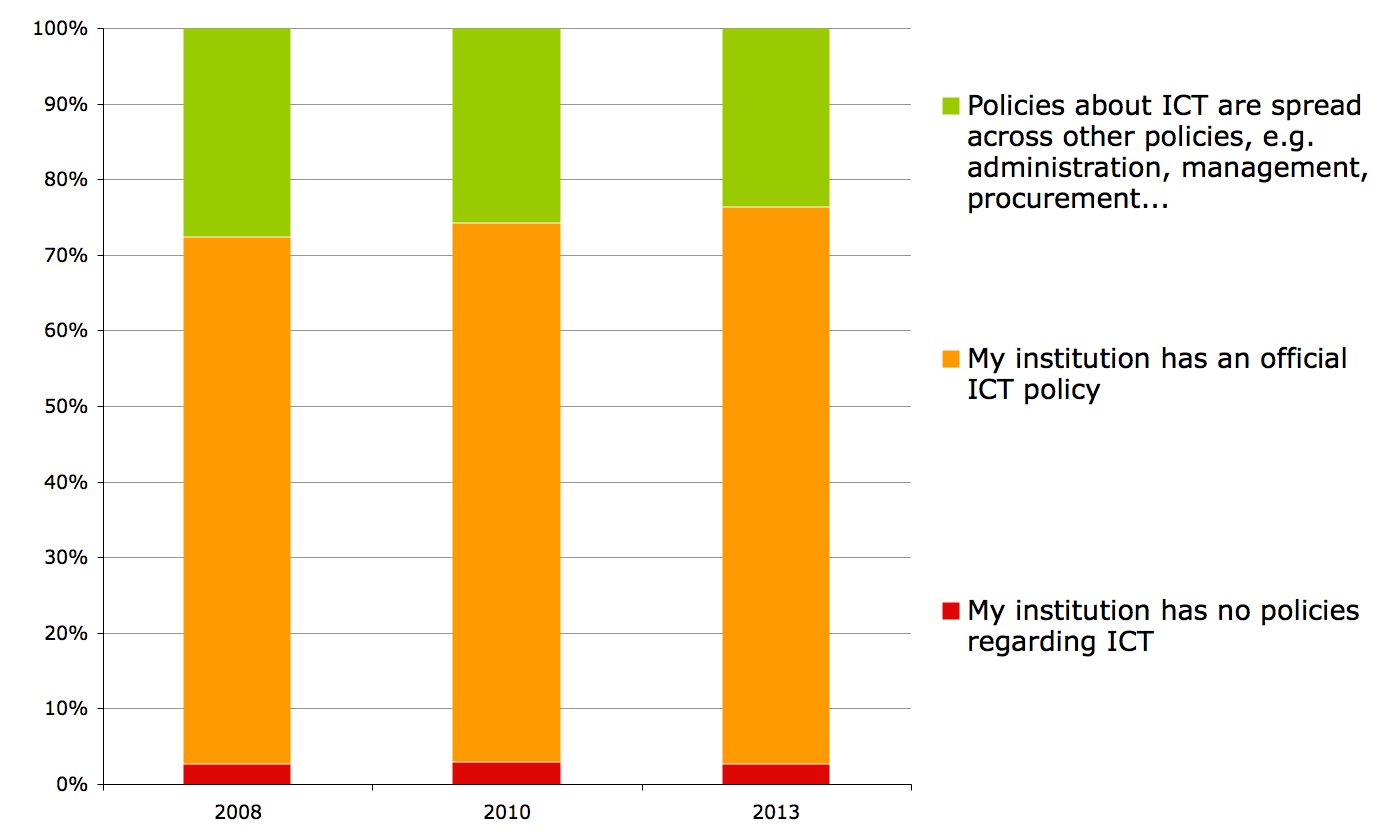
Figure 4a. ICT policies in institutions, 2008-2013
As shown in Figure 4b, there is also little variation between HE and FE.
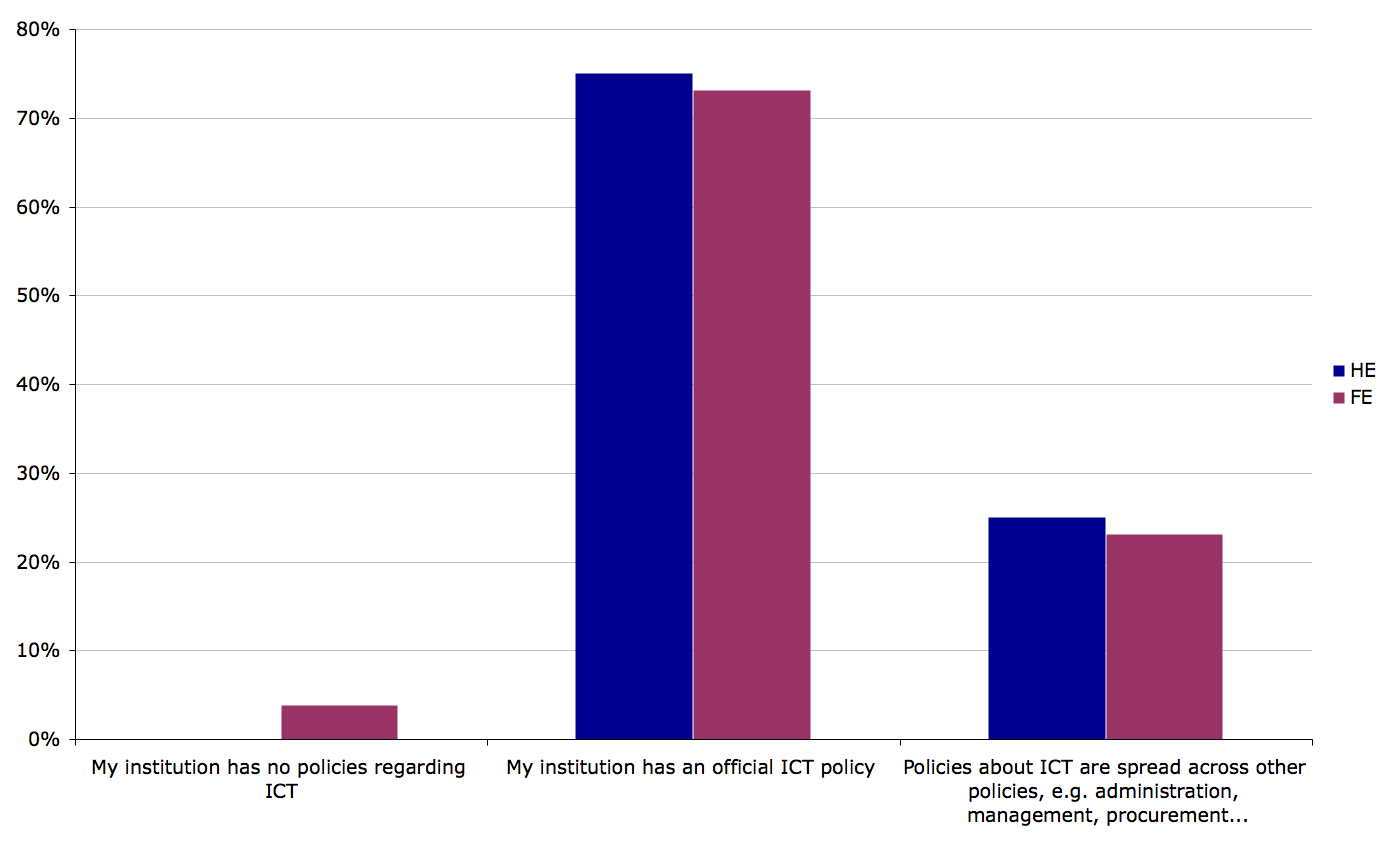
Figure 4b. ICT policies in FE and HE institutions
Q4a: Institutional policies for open and closed source software
Q4a. What best describes your institution’s policies about open and closed source software?
Looking at the history of ICT policies from 2003 to 2013 we can see a marked change in the way open source is considered.
Back in 2003, most IT policies in colleges and universities in the UK did not mention open source at all, while today that position is reversed.
We have also seen the demise of policies that prohibit open source, while at the same time policies that state a preference for open source also seem to be on the way out.
There is a dip from 2010-2013, but the overall trend would seem to be for institutions to have ICT policies that explicitly mention open source software as a procurement option.
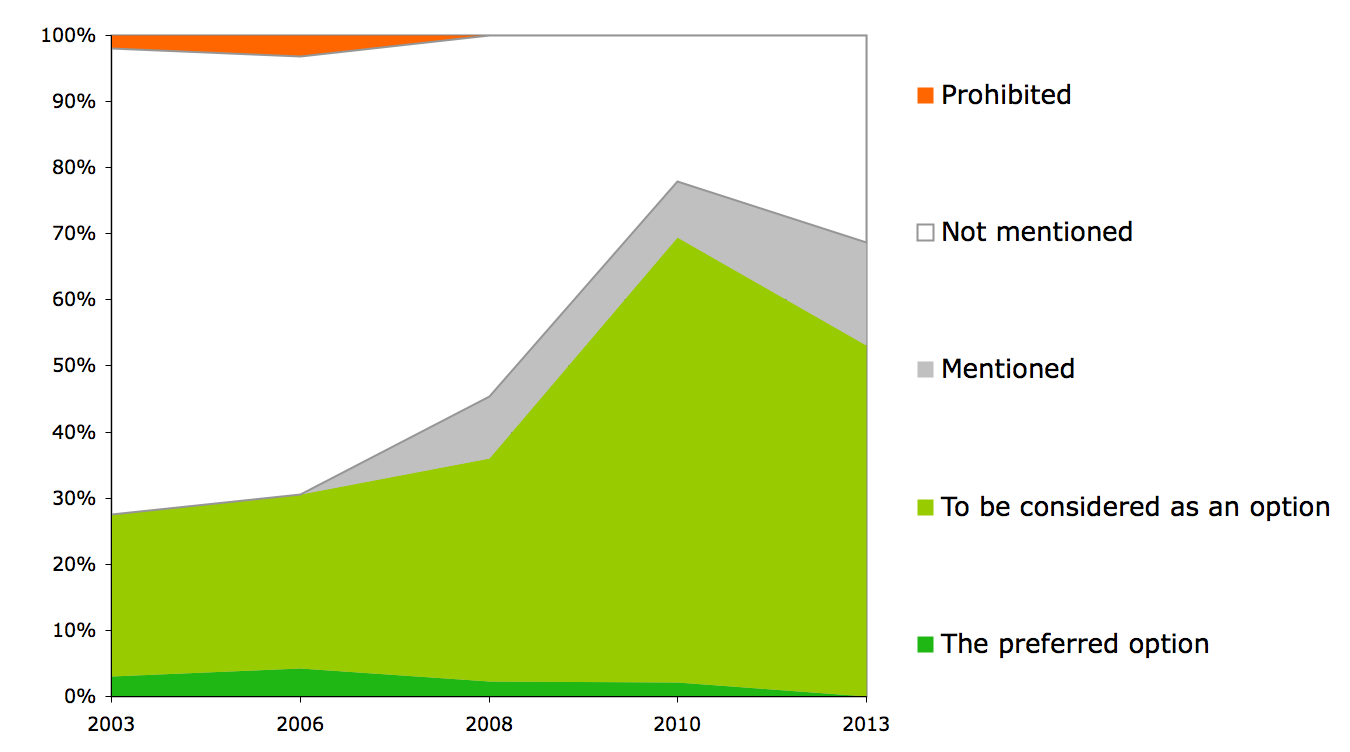
Figure 4c. Open source in ICT policies in institutions, 2003-2013
When comparing HE and FE, there is a notable difference, with HE institutions twice as likely to have a policy that mentions open source as a procurement option. This is interesting as there was very little difference found between policies in HE and FE in the 2010 survey.
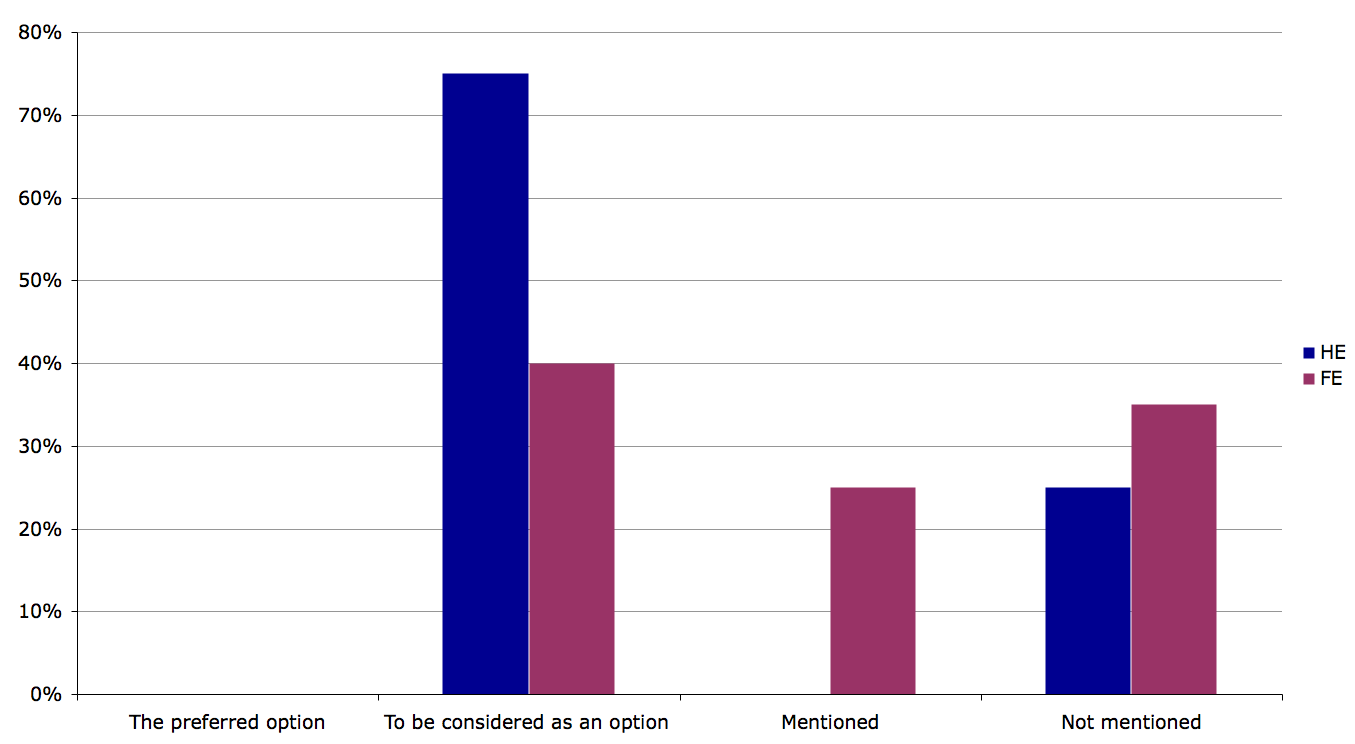
Figure 4d. Open source in ICT policies in institutions, comparing HE and FE
For closed source the pattern of responses is largely unchanged from the 2010 survey, the main difference being the proportion of policies that mention closed source as an option has dropped (from 70% to 60% in HE, and from 33% to 15% in FE).
However, the overall distribution for closed source is very similar to previous surveys, which suggests that the change in how open source is mentioned in the 2013 survey may be significant, with progress towards equal consideration of open source being made in HE, but not in FE.
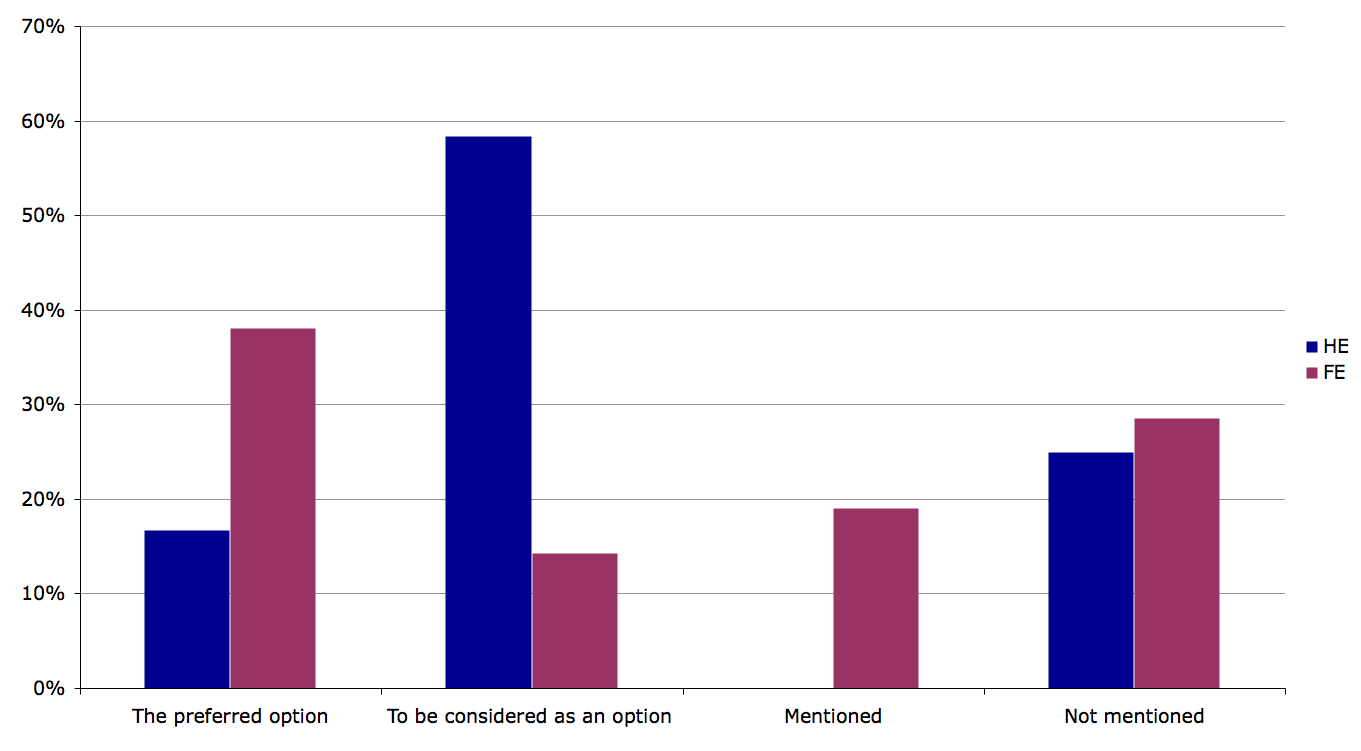
Figure 4e. Mentions of closed source in ICT policies in institutions, comparing HE and FE
Q5: Software considered for procurement/deployment in practice
Q5. In practice, what software is considered for procurement/deployment in your institution?
As with policies, the overall historic trend is towards equal consideration of open and closed source software, with the extremes of “only open source” and “only closed source” absent from the past two surveys.
However, if the ideal situation is assumed to be equal consideration, then the rate of change from 2008 to 2013 is hardly a cause for celebration, only rising from 20% in 2008 to 28% of institutions in 2013. If institutions are to take full advantage of open source in their procurement, more rapid changes to practice will be needed.
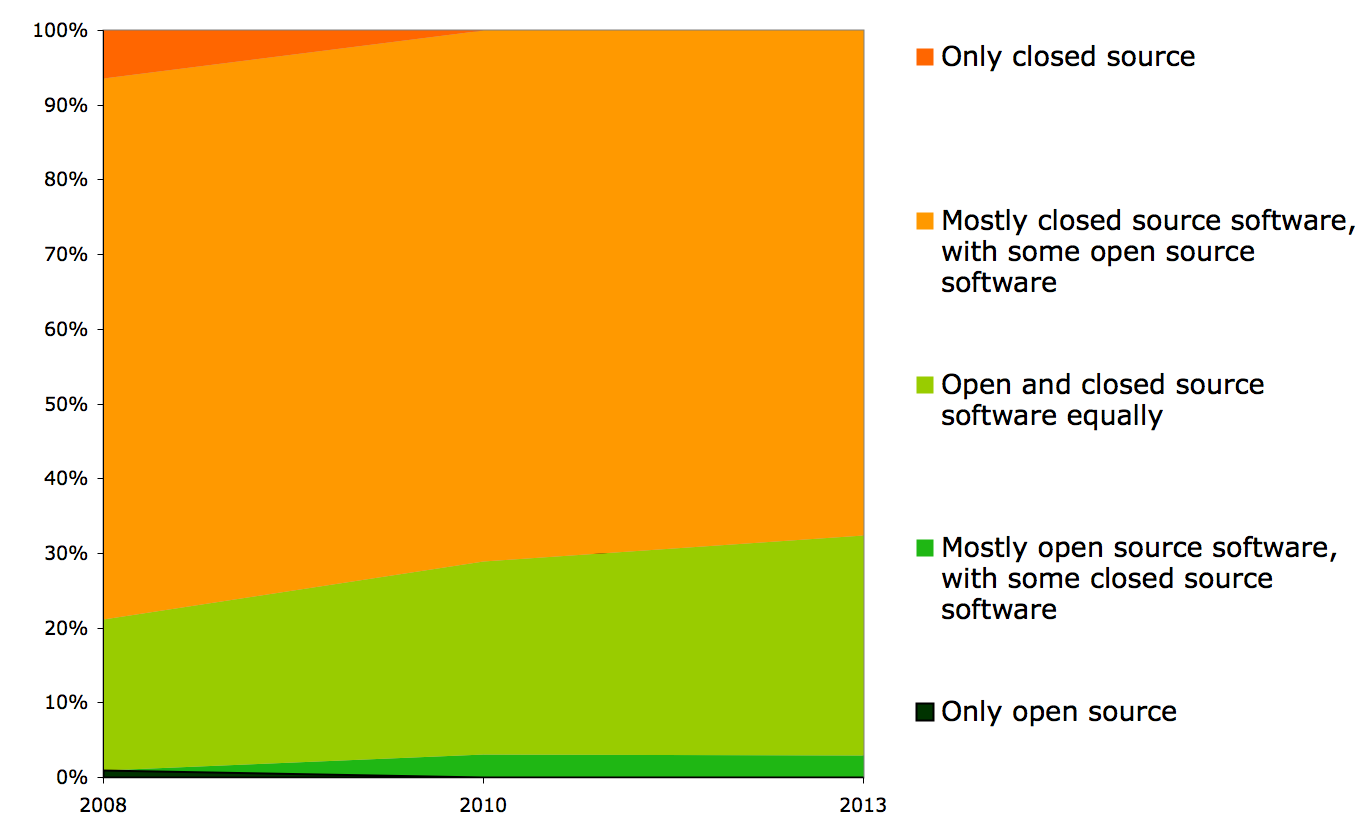
Figure 5a. Software considered for procurement in practice, 2008-2013
Looking at the picture for HE and FE in 2013, what is most notable is that there has been some singificant progress in HE towards equal consideration, from 29% in 2010 to 50% in 2013. However, for FE the overall picture is unchanged since 2010.
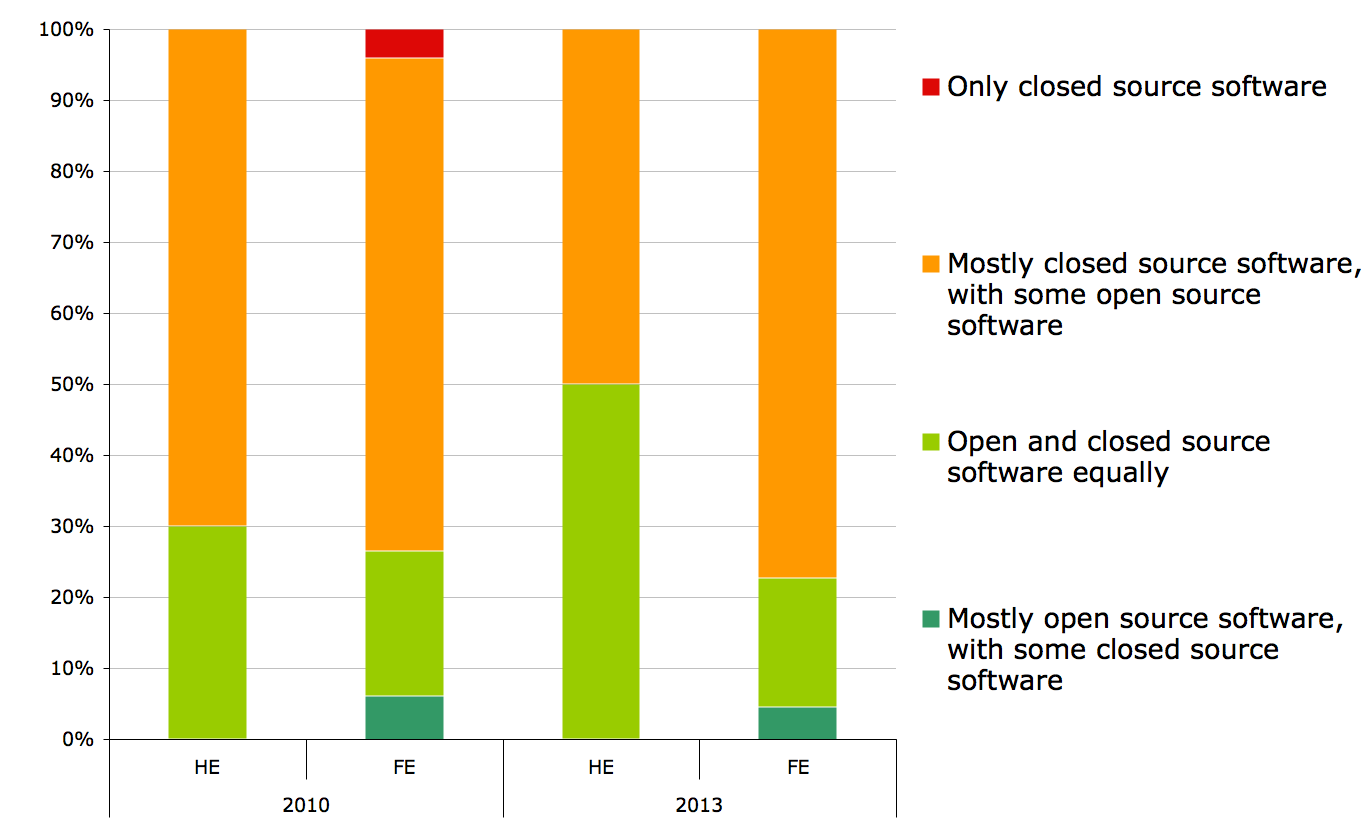
Figure 5b. Software considered for procurement in practice, comparing HE and FE
Taken together, the results paint a picture of steady progress towards equal consideration of open and closed source software in HE, but of little or no change in FE.
Do policy and practice go together?
Looking at the relationship between statements on policy and practice in combination, there is no consistent correlation between the two (Figure 5c). For example, in our 2010 survey institutions that mention open source in policies are the least likely to consider it in practice; whereas in 2013, institutions that mention open source in policies are the most likely to consider it in practice.
One interpretation is that policy sets an agenda for the institution that takes time to implement in changes to practice, and so we would perhaps see a correlation if we traced the changes in individual institutions over time.
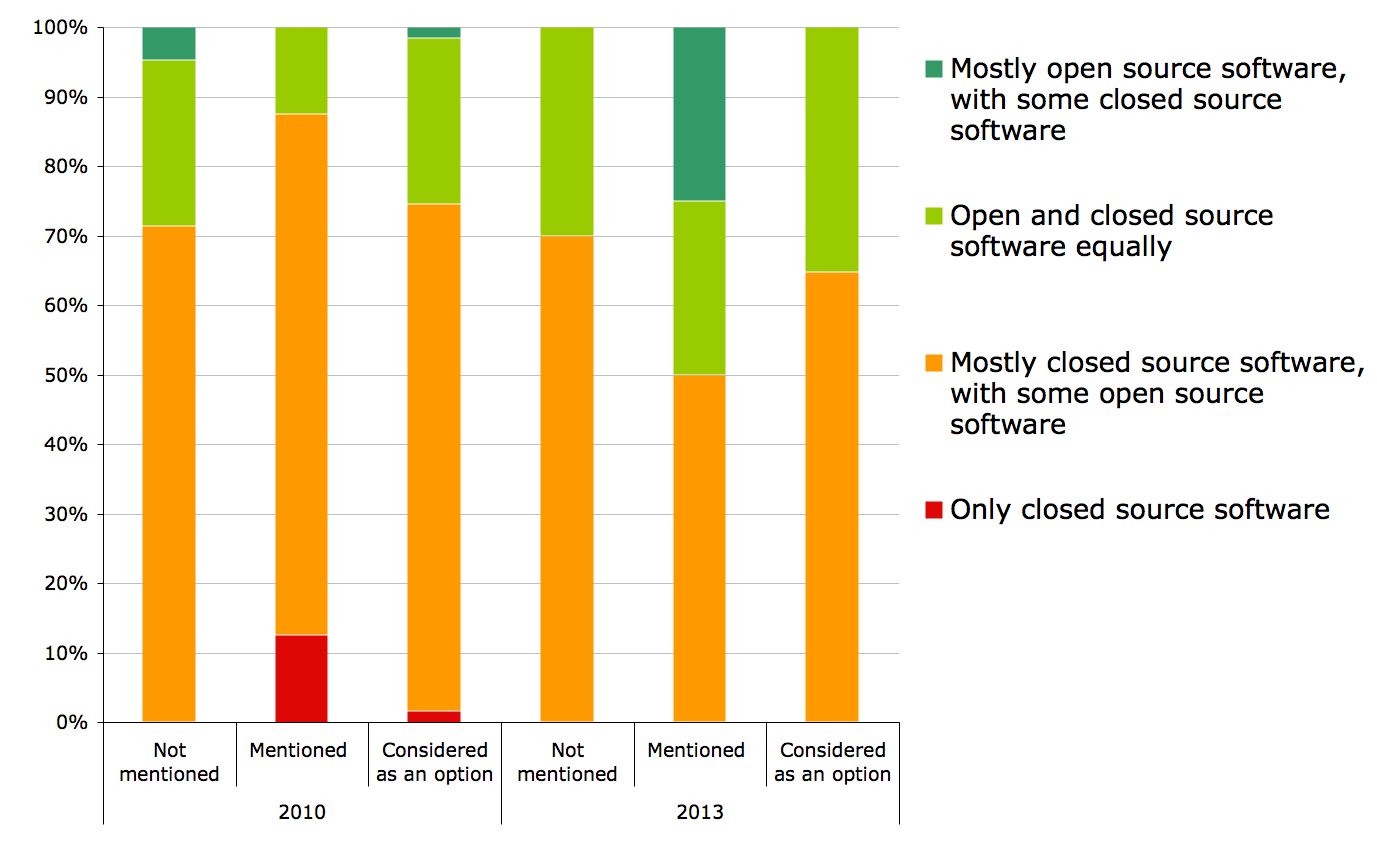
Figure 5c. Software considered for procurement in policy and in practice, 2010-2013
Previous section: General information about institutions
Next section: Staff contributions to open source software