

OSS Watch Scoping Study
by David Tannenbaum on 4 December 2003
Introduction
Abstract
This document reports on the scoping study carried out by OSS Watch to provide evidence for understanding and addressing the needs of higher education and further education (HE/FE) stakeholders in their use of Open Source Software. The data collection was carried out, and the report written from October to December 2003, with funding from the JISC.
OSS Watch is a pilot advisory service for UK higher and further education funded by the Joint Information Systems Committee (JISC) and hosted by the University of Oxford. It is based within the Research Technologies Service of Oxford University Computing Services.
Acknowledgments
Deep thanks are due first to the survey respondents, and the site visit interviewees who took time out of their day with little in the way of immediate gratification. Special thanks are due to Professor David De Roure and Nicky Harding, who lined up an invaluable day of interviews.
Anna Zimdars in the Oxford Sociology Department provided a steady stream of helpful advice on survey design and statistical analysis. Shayna Strom provided moral support, as always.
Finally, many thanks to Professor Paul David for recommending the author (David Tannenbaum) to work on such an interesting project.
Copyright
This document is © 2003 University of Oxford and David Tannenbaum
Permission is granted to copy, distribute and/or modify this document under the terms of the GNU Free Documentation License, Version 1.2 or any later version published by the Free Software Foundation; with no Invariant Sections, no Front-Cover Texts, and no Back-Cover Texts. A copy of the license can be found at http://www.gnu.org/licenses/fdl.html#SEC1.
Trademarks have been used in this document for purposes of identification only. The author acknowledges the ownership of these trademarks.
Abbreviations
- FE
- Further Education
- FLOSS
- Free/Libre/Open Source Software
- HE
- Higher Education
- OSS
- Open Source Software
- TCO
- Total Cost of Ownership
Aims and Objectives
The purpose of this scoping study is to provide evidence for understanding and addressing the needs of key higher education and further education (HE/FE) stakeholders in their use of Open Source Software.1 The findings and recommendations from this report are intended to guide OSS Watch in its work over the next 18 months. The specific aims of the scoping study are as follows:
- to provide evidence for understanding and addressing the needs of key HE/FE stakeholders in their use of OSS
- to discover how IT managers deploy, and plan to deploy, OSS at HE/FE institutions
- to discover how software developers at HE/FE institutions use, and plan to use, OSS tools, licenses and development paradigms
- to discover how end-users at HE/FE institutions use OSS applications
- to discover interest in longer-term HE/FE development or participation in the OSS community
- to make recommendations based on the accumulated evidence, on how OSS Watch can best serve the HE/FE community over the next 18 months
- to identify areas in which further study of OSS issues in the UK HE/FE community is needed
Background: Open Source Software in the UK, Past and Present
The broad outlines of Open Source Software’s history and growing popularity are by now common knowledge, but details of the history of OSS development, recent developments in UK and EU policy regarding OSS use in the public sector, hard data on OSS use, and even the definition of OSS are less well-known.
This section of the report covers these topics briefly, and suggests a role for OSS Watch in collecting and disseminating existing and new information.
Definition of Open Source Software
Open source software may be characterised as software for which:
- the source code is available to the end-user;
- the source code can be modified by the end-user;
- the licensing conditions are intended to facilitate continued re-use and wide availability of the software, in both commercial and non-commercial contexts;
- the cost of acquisition to the end-user is often minimal.
A more precise definition may be found at www.opensource.org/docs/definition.php and the philosophy underlying open source is ably explained at www.gnu.org/philosophy/.
In the Beginning…
It is commonly assumed that free software is a relatively recent phenomenon, originating in Richard Stallman’s founding of the GNU Project, and gaining critical mass with the success of Linux, and the coining of the term Open Source Software in 1998.
However, the practice of distributing source code that can be modified by the end-user with a minimal cost of acquisition is as old as software itself. In fact, the practice arguably has its roots in the United Kingdom, which was a pioneer in the early development of hardware and software. The first stored-program computer capable of storing a program in memory was probably designed and built at the University of Manchester. The Small-Scale Experimental Machine (SSEM), commonly known as the Baby, ran its first program on June 21st, 1948.2
Mainframe software sharing in England was later facilitated by user groups such as SHARE, for IBM machines, and DECUS UK for DEC machines.3 The use of Unix, the source code of which has been available under more or less unrestricted terms at over its history, has been widespread in UK higher education.
A vibrant UK community of hobbyist programmers shared source code for early personal computers such as the portable Osborne, as shown by ads for user groups and source code listings in popular magazines like Personal Computer World.
The Growth of Open Source Use in the UK
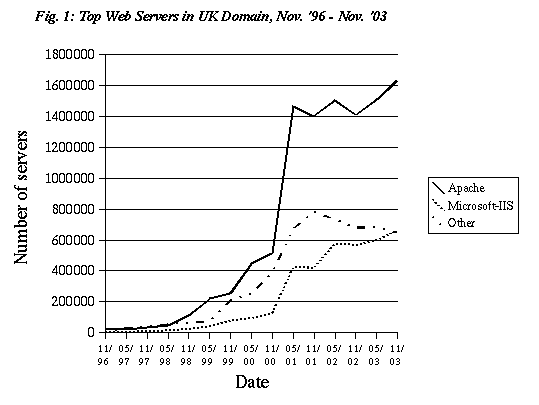
In the past decade, software identified as free or open source software has gained significant market share worldwide. A 2001 report on OSS commissioned by the UK government predicted, Within five years, 50% of the volume of the software infrastructure market could be taken by OSS. The report also predicted that OSS would become a market leader in consumer computing devices and middleware.4
One of the most striking examples of growing OSS use has been the web server, Apache. Apache’s domination of the global market is widely cited, and an analysis of more local trends shows that it has also become a market-leader in the UK (see Fig. 15).
Other evidence suggests that OSS software use in the UK is consistent with that in other European countries. In a 2002 European-Commission-funded telephone survey of for-profit and public establishments in the UK, Germany and Sweden, the highest rate of OSS usage was in large UK firms (more than 500 employees) with high IT expenditures (see Table 1). OSS usage in other UK sectors was more or less comparable with Sweden and Germany.6
| UK | Sweden | Germany | ||||
| small | large | small | large | small | large | |
| High intensity firm | 25.0% | 74.1% | 20.4% | 13.2% | 27.0% | 51.3% |
| Medium intensity firm | 39.1% | 9.1% | 14.6% | 32.8% | 45.5% | 51.3% |
| Low intensity firm | 25.0% | 14.3% | 13.6% | 20.3% | 52.8% | 44.4% |
| Public sector | 32.8% | 38.2% | 16.4% | 23.5% | 44.4% | 69.0% |
| Total | 31.5% | 17.7% | 43.7% | |||
Note: Intensity refers to the level of IT expenditure. (Total n=1,452; For the UK public sector, n=33, and includes government and education). Source: Wichmann, p. 17.
OSS Development Projects Based in the UK
The conventional wisdom is that nearly all cutting edge software development is concentrated in the US However, because OSS development is carried out almost entirely via the internet, opportunities for UK leadership in OSS projects are widespread.
The precise extent of OSS development in the UK is difficult to determine, but there are several well-known leaders and projects based in the UK. The most prominent developer is Alan Cox, until recently the number two project leader for Linux and still a hugely influential figure in the OSS community. Other notable OSS projects with UK roots include Philip Hazell’s exim and Michael Kay’s Saxon. James Clark, a native Briton who is now based in Thailand, is one of the most influential people in the global XML community, and is responsible for classic free software projects such as groff and sp.
The role of OSS in the UK commercial sector is less certain. The 2001 report to the UK government mentioned above notes, We are not aware of any UK companies that are developing and publishing significant Open Source software…. If Open Source becomes a significant part of the software industry, the UK is very poorly placed to take advantage.7 However, rough measures suggest that there is a healthy industry of OSS consultants—out of 32 European Linux consultancy companies listed in the Google Directory, 16 are based in the UK.8
UK Government Policy
In recent years, the UK government has taken an interest in utilizing OSS in the public sector, and has even taken steps towards promoting its use more broadly. Official interest began with the aforementioned 2001 report, which concluded that, OSS is indeed the start of a fundamental change in the software infrastructure marketplace, and is not a hype bubble that will burst.
The report recommended that the Government should consider using OSS as the default exploitation route for UK Government-funded software…. Open Source has been the de-facto standard for the exploitation of academic software research in the US for many years. It is hard to over-state the beneficial effect that this has had on the technology and the wider computer industry.
The report also noted, The Open Source model offers a new paradigm for funding software in communities-of interest (e.g. Health and Education). There is some indication that such projects are developing in other countries and the Government could consider running pilot projects to test the viability of the OSS approach to such software.9
Following this report and the Action Plan for the European Commission’s eEurope initiative (see below), the Office of the e-Envoy issued the following policy decisions in July 2002:
- UK Government will consider OSS solutions alongside proprietary ones in IT procurements. Contracts will be awarded on a value for money basis.
- UK Government will only use products for interoperability that support open standards and specifications in all future IT developments.
- UK Government will seek to avoid lock-in to proprietary IT products and services.
- UK Government will consider obtaining full rights to bespoke software code or customisations of COTS (Commercial Off The Shelf) software it procures wherever this achieves best value for money.
- UK Government will explore further the possibilities of using OSS as the default exploitation route for Government-funded R&D software.10 In the same month, the Cabinet Office Minister of State, Douglas Alexander MP, said, This government is intent on securing the best value for money in its IT procurements by encouraging the development of a flourishing IT industry which supplies both proprietary and Open Source Software solutions to the public sector.11
In October 2003, the government announced that it would begin action on the first policy point by staging nine proof of concept trials of the use of OSS in the public sector.12 Beginning in February 2003, the Office of the e-Envoy began holding meetings on the final policy point, regarding OSS as a default exploitation route for government-funded R&D software, with academics, industry representatives, and other stakeholders. The government has yet to release a final policy decision on this issue.
European Commission Policy
The UK government’s initiatives have been spurred in large part by European Commission policies, particularly the e-Europe Action Plans:
- The 2001 Work Programme for the Framework 6 IST (Information Society Technologies) has as one of its 9 priorities to foster the development and use of Open Source Software.
- The 2002 eEurope Action Plan includes a goal of promot[ing] the use of Open Source Software in the public sector and egovernment through exchange of experiences across the Union.13
- The 2005 eEurope Action Plan commits to issuing a pan-European interoperability framework by the end of 2003 that will be based on open standards and encourage the use of open source software. Community research activity on security intends to support standardisation with a view to wider use of open standards and open source software. Forthcoming guides to good practices would typically consist of a methodology, an associated set of tools and software in open-source form.14
- The European Commission has just published a guide to transitioning to OSS, written by a UK company, for IT managers in public administrations within Europe. The guide is meant to help Administrators decide whether a migration to OSS should be undertaken, and to describe in broad technical terms how such a migration could be carried out.15
Recommendations 2.1 - 2.4
-
There is currently a dearth of information on the use of OSS in the UK, the scope of involvement by UK developers in OSS software, and the size of the commercial OSS sector in the UK. Although it is beyond OSS Watch’s remit to engage in extensive surveying beyond the HE and FE sectors, stakeholders clearly have an interest in this knowledge for designing their curricula and research programmes.
- An ongoing comprehensive search for additional public domain data on the state of OSS should be carried out. This might take the form of either internal OSS Watch research or commissioned research.
-
UK government policies can have a direct impact on the research programmes and user requirements of HE and FE institutions. However, nascent policy on OSS in academia, such as the recent draft directive to establish OSS as the default licensing route for R&D software, are not currently well-publicised or systematically tracked by stakeholders. It is also not clear that academic stakeholders are well organised in their response to government proposals.
- UK government policy developments should be tracked and summarised, including information on meeting dates and links to primary documents. These summaries might be made available to stakeholders through a regular newsletter and/or the OSS Watch website.
- Given the apparent lack of coordination in interfacing with government, a focal point is needed for the communication of academic stakeholders’ concerns to policymakers.
-
Since the UK government is clearly committed to acting in line with EC policy directives, particularly the eEurope Action Plans, it will be important for UK HE and FE stakeholders to understand unfolding developments in the EU. As OSS has been identified as an important element in improving the competitiveness of the UK’s IT industry, it will also be important to track policies in member and non-member countries, as well as in the US and elsewhere.
- Stakeholders should have easy access to new EC directives, policy developments in member states, and in states outside the Union. These might be compiled in a regular newsletter that summarises recent policy changes and is tailored to the needs of UK HE and FE institutions.
Open Source in UK HE and FE
General usage of OSS, OSS development in the UK, the state of the OSS commercial sector, and government policy, all have an impact on the IT decisions made by HE and FE institutions. However, in order to provide recommendations on the direction of OSS Watch’s services it is necessary to understand how OSS is currently being used and developed in UK HE and FE institutions, and what concerns the stakeholders themselves have. Unfortunately, very little research into these questions has previously been done.
In order to better understand the current state of play, OSS Watch undertook a scoping study, consisting of a survey and supplementary site visits. The results of the study are described in this section, and recommendations based on the outcomes are interspersed throughout.
Previous studies
As mentioned above, very little hard data exists on the use and development of OSS in the UK, and this is as true for the education sector as anywhere else. A handful of studies have examined OSS in UK HE and FE institutions, but none have succeeded in collecting enough data to make decisive conclusions.
The most recent relevant study was led by David Glance and Alex Reid at the University of Western Australia and looked at the use of OSS in higher education in Australia, New Zealand and the UK. However, only 6 UK institutions are represented, which is much too small a number to constitute a representative sample.16 In any case, the survey did not cover FE institutions, which are significantly different from HE institutions, and are major OSS Watch clients. The survey findings are nonetheless interesting for the purposes of comparison. For all respondents,
- Awareness of OSS was high for 47%; moderate for 34%; low for 19%
- Skills with OSS use were high for 22%; moderate for 56%; low for 22%
- Skills with the OSS process were high for 19%; moderate for 55% moderate; low for 26%
- 50% had significant intentions to deploy OSS; 44% had limited intentions
- Most deployment was in Infrastructure
- TCO, Independence, Interoperability were the top three cited benefits of OSS The only other known formal survey of the UK education sector is the FLOSS survey cited above (see Table 1), which also had a fairly low sample of 33 cases in both the education and government sectors.
Overall Scoping Study Objectives, Method and Target Population
The main objectives of the OSS Watch Scoping Study were to:
- discover how IT managers deploy, and plan to deploy, OSS at HE/FE institutions
- discover how software developers at HE/FE institutions use, and plan to use, OSS tools, licenses and development paradigms
- discover how end-users at HE/FE institutions use OSS applications
- discover interest in longer-term HE/FE development or participation in the OSS community The study took a two-fold approach to surveying the HE and FE community. The first was a self-administered survey conducted via the web, which was available from October 2nd – November 21st. The second was a limited number of site visits and phone interviews that were used to supplement our understanding.
The target population included HE/FE staff who make decisions on purchasing and planning, and developers who might use OSS tools, licenses, or development paradigms. The breakdown of survey respondents’ job responsibilities (see Table 2) suggests that the survey was fairly successful in sampling the targeted population of respondents. A relatively low percentage of respondents were responsible for software development, but this was mitigated somewhat with face-to-face interviews with eight software developers at the University of Southampton.
| Job Responsibility | Number (Percent) |
| Short-term software procurement | 50 (74%) |
| Medium-term software procurement | 54 (79%) |
| Long-term software procurement | 52 (77%) |
| Training | 36 (53%) |
| Software development | 36 (53%) |
| Distribution licence design or approval for software developed in-house | 15 (22%) |
Note: N=68.
Survey Design
The survey was split into three different sections (see Appendix A for the full survey). The first section covered information about the respondent and basic characteristics of the institution he or she was representing. The second section asked about IT strategy, and the final section asked about IT development.
The substance of the design was largely constrained by our desire to keep the survey questions consistent, and therefore comparable, with those used by Glance and Reid from the University of Western Australia.17
The layout and technical design of the web survey followed recommended best practice. The design was interactive with multiple pages, as this was known to reduce item non-response. Progress indicators were used so that respondents did not feel engaged in an endless exercise, and graphics were kept to a minimum.18
Survey Administration
It is always difficult to survey individuals who are not representing their personal views, but those of an institution. Decision-making is not typically invested in a single individual, and requests for information on a wide range of topics may decrease response rates—finding the best individual to answer for an institution takes more resources and time than were available to us. This is particularly true for the many HE universities that have dispersed organizational structures.
The FLOSS survey report noted that surveying IT managers is particularly difficult, since people being responsible for IT related issues in commercial establishments currently belong to the most often interviewed professionals and are therefore typically reluctant to participate if they are not directly contacted.19 But some factors worked in our favour–the target population is highly wired, and JISC, the sponsor of the survey and a conduit for a large number of survey invitations, is a well known and respected institution.
Another downside to our web-administered survey was that if a question was worded ambiguously, or a respondent was otherwise confused, there was no one readily available to answer questions. This was remedied somewhat by including a Details or Comments box for nearly every question.
Although it would have been ideal to follow up with non-responsive institutions via direct telephone surveying, and perhaps even through postal mail follow-ups, resource and time constraints made this a virtual impossibility.20 In any case, the self-administered web survey approach yielded a relatively decent number of responses, and there was no indication that respondents were generally confused by any of the questions asked.
A link to the survey was sent out to a number of e-mail lists for IT managers and software developers in an e-mail that explained the purpose of the survey and gave a brief description of OSS Watch. Once respondents arrived at the website they were given the opportunity to take the survey online, or download a PDF version (this was also provided in case respondents wanted to gather requested information before taking the survey online). Of sixty-eight respondents, only one sent in a hard copy of the survey.
To the extent that we were successful in getting an acceptable number of respondents, this was probably due in large part to the follow-up e-mails sent to various lists, and reference to the scoping study at various conferences and meetings with key stakeholders. Although the preferred method of personally following up with potential respondents who had received the survey link through a list was impossible due to data protection concerns, we did send personal e-mails to some individuals located through website trawls. Towards the end of the survey period, a chance to win two £50 Amazon.com gift certificates was offered to all previous and future respondents, and this seemed to have a marginal effect on the response rate (see Table 3).21
| Date | Event | Cumulative responses |
| 26/9 | Full study sent to OSS Watch advisory committee for comment. | -- |
| 2/10 | Announcement of the study sent by e-mail to UCISA Directors email list, RUGIT group e-mail list, and to RSCs via JISC Advisory & Support Services. | -- |
| 13/10 | Reminder e-mail sent to the above lists. | 8 |
| 15/10 | A notice about the study appeared on the JISC-ANNOUNCE e-mail list. | 17 |
| 20/10-24/10 | Individual e-mails sent to IT Directors/Manager at HE. | 22 |
| 20/10-24/10 | Individual e-mails to IT Managers at FE. | 22 |
| 22/10 | Survey promoted at RSC National Technical Forum Meeting | 27 |
| 5/11 | Addition to website and e-mail announcements drawing attention to Amazon gift certificates available for participation. | 49 |
| 21/11 | Last survey response received | 68 |
Note: Cumulative response is the number of responses as of the day before the event listed.
Survey Sample
The response rate for the OSS Watch survey compares favourably with previous studies. Out of 168HE institutions which could have received our survey invitation, 29 were represented in the completed survey sample. Out of the 514 FE institutions which were sent our survey invitation, 34 were represented in the completed sample.
Although this response rate is good relative to the few previous attempts at surveying this population, it is still too low to take anything but an extremely cautious approach to the interpretation and generalization of data drawn from the sample, particularly for FE institutions.
The low rate of response suggests that if OSS Watch wants to reach a high percentage of its base for future projects which require feedback, e-mail contact alone may not be sufficient, especially for FE institutions. However, it is difficult to know exactly why the response rate is so low. Some possibilities are:
- the surveys did not get to the right people, and better contact lists need to be made;
- there simply was no right person, either because the survey was too comprehensive or because some institutions simply do not have an individual responsible for formulating IT strategy;
- e-mail is not an effective medium of communication, or it is only effective when paired with multiple contacts via phone and postal mail;
- potential respondents were asked to do something for very little in the way of immediate payback and token incentives need to be provided up-front
An additional complication in interpreting the survey results was inevitably introduced by the issues of how to define an institution. It was nearly impossible, given our resources and time frame, to target the survey only to people who could answer for their entire university or college. To achieve some measure of consistency we therefore asked respondents to identify whether they were answering for their entire institution, or only a section.22 The breakdown of respondents is given in Table 4.
| No. of institutions | Institutions responding | Total Respondents | Answering for whole institution | Answering for section of institution | |
| HE | 168 | 29 (17%) | 34 | 14 (41%) | 20 (59%) |
| FE | 514 | 34 (7%) | 34 | 27 (79%) | 7 (21%) |
| Total | 682 | 63 (9%) | 68 | 41 (60%) | 27 (40%) |
However, these categorizations might be unreliable due to an ambiguity in the survey directions. The directions read In what follows, the term ‘organisation’ is used for the entity for which you are providing responses. If you are able to respond on behalf of the whole institution, please do so, even if you have to make rough estimates. Survey respondents may have taken this as license to respond for the whole institution for some questions, and only for their section for other questions. Ideally the survey should have been tested extensively before deploying, and this ambiguity eliminated, but time constraints on the design phase made this impossible.
However, there are a number of reasons to believe that the integrity of the data collection was not undermined by this ambiguity.
There is some statistical evidence that suggests the comparability of HE responses. A Mann-Whitney test comparing the HE whole institution group (HE-W) with the HE section group (HE-S) in terms of students served did not find strong evidence to reject the null hypothesis that the groups are comparable in this respect (sig.=0.36). But note that the survey directions are worded in such a way that a respondent may have answered for their entire institution when describing the number of students served, but answered only for their section in responding to substantive IT strategy and development questions.
Concern that this may be the case is tempered by the observation that of the 20 HE respondents who said they were responding for a section of their institution, 16 were answering for departments whose names suggested that they oversaw IT for a significant portion of the institution (e.g. ICT Services,Computing Service,Systems and Services . See Appendix D for a full list.) It is therefore not unreasonable to deem the majority of HE responses for the whole and the section as comparable.
However, a Mann-Whitney test for students served by FE-W and FE-S did find strong evidence to reject the null hypothesis that the FE groups are comparable. (sig.=.05) But again, note that the directions are worded in such a way that a respondent may have answered for their section when describing the number of students served, but answered for their entire institution in responding to substantive IT strategy and development questions.
Of the 7 FE respondents who said they were responding for a section of their institution, 3 were answering for departments whose names suggested that they oversaw IT for a significant segment of the institution (e.g. Learning resources, Computing Services). The rest seemed to be academic departments (_e.g._Systems Development, Online Learning. See Appendix D).
In any case, most of the time HE and FE respondents from the Whole group gave answers consistent with those from the Section group. However, in cases where there were significant differences between the Whole and Section groups, the data are shown separately. Note though that even when data is separated out there may be double counting if multiple respondents from one university answered for their section for some questions and answered for the whole institution for others—since there were so few cases of multiple respondents from a single institution, these effects are minor.
Another concern with our web-based survey is self-selection bias—those with more interest in OSS, either for personal reasons or because their institution makes extensive use of OSS, may have been more likely to link to the web survey and take the time to fill it out. We might also expect highly-motivated early respondents to have stronger views than the respondents who answered the survey only after several reminders. Unfortunately it is nearly impossible to determine the extent to which the phenomenon is expressed in our sample. Since this survey is among the first of its kind, there are few benchmarks for comparison.
Finally, it should be noted that the respondents’ answers are analysed in terms of their status as HE or FE institutions, rather than the size of their student and staff population. The largest size differences in the sample are between HE and FE institutions in any case. While size within the HE and FE cohorts does matter, the FLOSS survey results suggest that it does not matter as much as the type of institution surveyed. However, analysis based on institution size would be a useful area of further research.
| Students | Academic Staff | Other staff | |
| HE | 369,011 | 52,285 | 32,984 |
| FE | 326,373 | 12,395 | 6,150 |
| ALL | 695,384 | 64,680 | 39,134 |
Note: For Students, N=67; Academic Staff, N=64; Other staff, N=63. In the case of multiple respondents for a single institution, only the highest number of students or staff was used.
| Desktop Computers | Servers | |
| HE | 102,049 | 5,106 |
| FE | 31,822 | 722 |
| ALL | 133,871 | 5,828 |
Note: For Desktops, N=64; Servers, N=64.
Site Visit Method
Interviews were conducted with nine individuals at two HE institutions and one FE college. Seven of the interviews were face-to-face and lasted from 45 to 60 minutes. Questions were drawn from a standard template, based on the expertise of the interviewee (see Appendix B).
The interviews were not intended to be scientific or representative, but instead to help us understand our survey results, and the processes by which institutions make decisions on IT strategy in general and OSS in particular.
Mini-survey Method
In addition to the OSS Watch Scoping Survey, a short questionnaire was posted on the OSS Watch website over the course of several months (see Appendix D). Site visitors who wanted to sign up for the OSS Watch e-mail newsletter were asked to fill out the questionnaire. Relatively little is known about these respondents, and their responses should be considered cautiously.
Questions in the mini-survey focused on what services respondents would find helpful from OSS Watch, and these were helpful in formulating the recommendations in this report.
Recommendations 3.1 – 3.2
One of the greatest challenges of administering the survey was insuring that the right person at each institution was surveyed. Since OSS Watch’s role is primarily advisory, an up-to-date list of contacts and a means of reaching potential clients is essential for its future work.
- OSS Watch might consider building its own database of relevant contacts at HE and FE institutions.
The OSS Watch Survey had a low response rate, particularly for FE colleges. Surveys of HE and FE institutions with higher response rates used a combination of e-mail, telephone, and postal mail contact.23 Up-front incentives have proved effective in other contexts for raising response rates.
- Future surveys should seek a higher response rate with multiple contacts with potential respondents, via multiple means. This will require a greater investment in resources and time.
-
Future surveyors should also consider the use of up-front monetary incentives. Aside from the low response rate, the biggest threat to the survey data’s reliability is the ambiguity of one of the survey directions.
-
Future surveys should allow flexibility in the survey design timeline to correct for ambiguities and other unanticipated problems. Even a small number of face-to-face interviews were extremely helpful in revealing the complexities of OSS use.
- OSS Watch should consider conducting focus groups in which stakeholders can discuss their concerns for OSS in a structured way. This may be a more cost efficient substitute (or complement) to a comprehensive survey, particularly if the focus groups are carefully selected to be a representative sample.
Study Findings
Where results were consistent for Whole and Section respondents within the HE and FE cohorts, they are presented in the aggregate. Where there were significant differences, results are disaggregated.24 Findings from site visits are incorporate into the text where appropriate.
Open Source Software Skills
We were interested in what skills HE and FE institutions currently have in the use and deployment of OSS, and this was addressed in two survey questions (see Table 7 and Table 8).
| Very few with skills | Moderate # staff skilled with at least 1 OSS package | Significant # staff skilled with more than 1 OSS package | Total | |
| HE | 14 (41%) | 14 (41%) | 6 (18%) | 34 (100%) |
| FE | 30 (88%) | 4 (11.8%) | 0 | 34 (100%) |
| ALL | 44 (65%) | 18 (27%) | 6 (9%) | 68 (100%) |
Note: Highest values for each group are in bold.
| Very few with these dvlpmt skills | Moderate number of staff are somewhat familiar with the OSS dvlpmt process | Significant numbers of staff are skilled with the entire OSS dvlpmt process | Total | |
| HE | 20 (59%) | 10 (29%) | 4 (12%) | 34 (100%) |
| FE | 31 (91%) | 3 (9%) | 0 | 34 (100%) |
| ALL | 51 (75%) | 13 (19%) | 4 (6%) | 68 (100%) |
Note: Highest values for each group are in bold.
The results show that FE institutions have a clear skills deficit, with 88% of all FE respondents reporting very few staff skilled in the use of OSS. HE institutions have a fair number of moderately or significantly skilled staff. This suggests that OSS Watch will have to tailor some of its services differently for HE and FE institutions.
As might be expected, the lowest number of respondents from all groups reported that their organisations had many members with OSS development skills. This was more pronounced for FE institutions, of which less than 10% had a moderate number of staff who were somewhat familiar with the OSS development process. This outcome is consistent with the results of the Australian survey. This is somewhat concerning, given that many of the benefits of OSS (e.g. Community support, modifiability, quick bug fixes) are dependent on some familiarity with the OSS development process.
Information gleaned from interviews confirmed many of these findings. One FE IT manager characterised his institution’s level of OSS awareness as, Pretty low to be fair. However, there is some variation–within the academic computing department of the same institution, one site visit interviewee said,
All of the computing academic staff are aware of it and at least 50% of it make use of it in some form or another as part of their teaching. As far as the students, it’s quite a small percentage. Probably less than a quarter of the students have a strong interest in using OSS in the development process.
It was also clear that OSS skill levels varied widely between and even within departments. One site visit interviewee in a HE computer science department said,
Our level of knowledge of OSS is far higher than say it is in the history department, and you would expect that. But there are plenty of people in the department who know nothing about it at all. A lot of CS is very theoretical–a lot of people are just mathematicians. At least half the research is highly theoretical and doesn’t involve the researcher having to have any applied knowledge in the area.
Recommendations 3.3 – 3.4
- Training workshops targeted at FE institutions that would like to consider the deployment of OSS software, but have very few staff skilled in the use of OSS, should be carried out.
- OSS Watch might consider means of making stakeholders more familiar with the OSS development process so that they can utilize support and resources offered by the OSS community.
OSS Strategy
We were interested in the extent to which institutions have formed strategies that address OSS, and how these strategies are formulated. The survey results revealed that the majority of respondents’ institutions in all categories have an IT policy/strategy that does not mention OSS. (See Table 9.)
| No strategy | Strategy, but OSS not mentioned | Strategy is not using OSS | Strategy explicitly considers OSS | Strategy of OSS as preferred option | Strategy of OSS as only option | Total | |
| HE | 0 | 19 (56%) | 0 | 13 (38%) | 2 (6%) | 0 | 34 (100%) |
| FE | 2 (6%) | 27 (82%) | 1 (3%) | 3 (9%) | 0 | 0 | 33 (100%) |
| ALL | 2 (3%) | 46 (69%) | 1 (2%) | 16 (24%) | 2 (3%) | 0 | 67 (100%) |
Note: Highest values for each group are in bold.
A significantly higher number of HE than FE institutions (38% vs. 9%) have a strategy that explicitly considers OSS. Nearly none of the responding institutions has a strategy of not using OSS.
While very few institutions reported having no strategy, it seems likely that in many cases strategies are implicit and ad hoc, rather than written out and agreed on via a formal process. In one department, there was no explicit strategy, but IT support was offered only for a limited number of systems, effectively creating a de facto strategy. It is not uncommon for a strategy to exist for a central IT department but not affect the decisions of subject-area departments.
Follow-up interviews also revealed that although many institutional policies do not reject the use of OSS, deep concerns still remain. One interviewee said that although his institution was open to the possibility of deploying OSS,
The setup we’ve got at the moment works very well for us. It’s very stable, very reliable, and we’ve got a lot of expertise. And the cost to use we don’t consider that horrendous. So it’s going to take a fairly major disaster, either technical, financial, or from our user base, to make us want to move away…. The feeling we have here is, ‘if it ain’t broke, don’t fix it.’
Stakeholders’ specific concerns for OSS are detailed further below.
Recommendations 3.5 – 3.6
- Given that the majority of respondents have an IT strategy, but do not mention OSS in that strategy, stakeholders could helpfully be offered case studies of institutional strategies which do explicitly consider OSS and strategy templates based on these experiences.
- Subject-area departments may have very different concerns from central IT departments, and more information should be sought about the different IT policies and needs within institutions.
Status of Current OSS Deployment and Awareness
The survey assessed the status of OSS deployment and awareness at three levels of specificity. The highest level of abstraction encompassed OSS deployment in general. The second level covered the level of actual and planned deployment in particular application areas, and the final level was concerned with specific OSS programs.
The survey results showed that while OSS is widely used in a number of application areas, there are significant differences between HE and FE institutions in terms of general awareness and deployment. More specifically, HE and FE were generally comparable when it came to the deployment of the most popular OSS applications, such as networking systems, but less so when it came to applications slightly more off the beaten track, such as specialised application packages for subject-based communities. In such cases, HE institutions were more committed to OSS.
The following question (Table 10) was based on the Australian survey, and the number of respondents choosing one of the first three answer choices suggests that the question was read as asking more about current deployment than future deployment.
| Decided not to deploy | Now deploying in limited way | Now deploying in significant way | Deploying this year | Deploying within years | No decision made | Total | |
| HE | 1 (3%) | 14 (41%) | 15 (44%) | 0 | 0 | 4 (12%) | 34 (100%) |
| HE-W | 1 (7%) | 7 (50%) | 5 (36%) | 0 | 0 | 1 (7%) | 14 (100%) |
| HE-S | 0 | 7 (35%) | 10 (50%) | 0 | 0 | 3 (15%) | |
| FE | 2 (6%) | 14 (41%) | 9 (27%) | 1 (3%) | 0 | 8 (24%) | 34 (100%) |
| FE-W | 1 (4%) | 13 (48%) | 7 (26%) | 0 | 0 | 6 (22%) | 27 (100%) |
| FE-S | 1 (14%) | 1 (14%) | 2 (29%) | 1 (14.3%) | 0 | 2 (29%) | 7 (100%) |
| ALL | 3 (4%) | 28 (41%) | 24 (35%) | 1 (2%) | 0 | 12 (18%) | 68 (100%) |
Note: -W denotes respondents who answered for their whole institution; -S denotes those who answered for a section. Highest values for each group are in bold.
Most respondents reported that they had either deployed OSS in a limited or significant way; this is consistent with the findings of the Australian survey. Few institutions have decided not to deploy OSS, or have not made any decision on deployment. This indicates the relevance of OSS to nearly all HE and FE respondents, though deployment was slightly more significant for HEs, and HEs were more likely to have come to some decision.
These results can be compared with answers to another survey question about organisations’ overall level of awareness of open source (Table 11).
| Very few more than slightly aware | Looked into by quite a number, or a few in depth, but more info is needed before deploying | Investigated and decisions have been made on deployment | Total | |
| HE | 9 (27%) | 13 (38%) | 12 (35%) | 34 (100%) |
| FE | 20 (61%) | 8 (25%) | 5 (15%) | 33 (100%) |
| ALL | 29 (43%) | 21 (31%) | 17 (25%) | 67 (100%) |
Note: Highest values for each group are in bold.
The majority of HE institutions (73%) have either looked seriously into OSS and/or have already made some decisions about its deployment. However, FE institutions are significantly further behind in terms of awareness and decisions about deployment. Sixty-one percent of respondents said that very few members of their organisation were more than slightly aware of open source concepts. Only 15% had made decisions on deployment of OSS.
The following question was asked to ascertain deployment in specific areas (see Appendix A for a more exact specification of the answer categories):
Q21. If your organisation has already deployed / has plans to deploy open source software, in which areas has it been deployed? Please select the best description of your institution’s involvement with this software on a scale of 1 to 4
Legend
0 = Not deployed (added after survey administered and substituted for null answers)
1 = Casual use of OSS by individuals on an occasional basis
2 = Organisation reliant on certain OSS products, but no involvement in development
3 = Organisation reliant on certain OSS products, and occasional contributor to their
development
4 = Organisation is mainstream OSS developer
| Operating Systems - Deployed | ||||||
| 0 | 1 | 2 | 3 | 4 | Total | |
| HE | 5 (15%) | 9 (27%) | 15 (44%) | 4 (12%) | 1 (3%) | 34 (100%) |
| FE | 13 (38%) | 10 (29%) | 10 (29%) | 1 (3%) | 0 | 34 (100%) |
| Operating Systems - Planned | ||||||
| HE | 9 (26%) | 8 (24%) | 12 (35%) | 4 (12%) | 1 (3%) | 34 (100%) |
| FE | 18 (53%) | 7 (21%) | 9 (26%) | 0 | 0 | 34 (100%) |
| Networking Systems - Deployed | ||||||
| 0 | 1 | 2 | 3 | 4 | Total | |
| HE | 4 (12%) | 7 (21%) | 16 (47%) | 4 (12%) | 3 (9%) | 34 (100%) |
| FE | 11 (32%) | 5 (15%) | 17 (50%) | 1 (3%) | 0 | 34 (100%) |
| Networking Systems - Planned | ||||||
| HE | 8 (24%) | 6 (18%) | 14 (41%) | 3 (9%) | 3 (9%) | 34 (100%) |
| FE | 15 (44%) | 5 (15%) | 12 (35%) | 2 (6%) | 0 | 34 (100%) |
| Information Systems - Deployed | ||||||
| 0 | 1 | 2 | 3 | 4 | Total | |
| HE | 6 (18%) | 15 (44%) | 5 (15%) | 5 (15%) | 3 (9%) | 34 (100%) |
| FE | 17 (50%) | 11 (32%) | 5 (15%) | 1 (3%) | 0 | 34 (100%) |
| Information Systems - Planned | ||||||
| HE | 9 (26%) | 8 (24%) | 8 (24%) | 6 (18%) | 3 (9%) | 34 (100%) |
| FE | 17 (50%) | 12 (35%) | 4 (12%) | 1 (3%) | 0 | 34 (100%) |
| General-purpose User Desktop Systems - Deployed | ||||||
| 0 | 1 | 2 | 3 | 4 | Total | |
| HE | 4 (12%) | 17 (50%) | 8 (24%) | 4 (12%) | 1 (3%) | 34 (100%) |
| FE | 15 (44%) | 18 (53%) | 1 (3%) | 0 | 0 | 34 (100%) |
| General-purpose User Desktop Systems - Planned | ||||||
| HE | 10 (29%) | 10 (29%) | 9 (26%) | 4 (12%) | 1 (3%) | 34 (100%) |
| FE | 20 (59%) | 10 (29%) | 3 (9%) | 1 (3%) | 0 | 34 (100%) |
| Specialised Application Packages for Subject-based Communities - Deployed | ||||||
| 0 | 1 | 2 | 3 | 4 | Total | |
| HE | 7 (21%) | 17 (50%) | 7 (21%) | 3 (9%) | 0 | 34 (100%) |
| FE | 21 (62%) | 13 (38%) | 0 | 0 | 0 | 34 (100%) |
| Specialised Application Packages for Subject-based Communities - Planned | ||||||
| HE | 12 (35%) | 11 (32%) | 7 (21%) | 3 (9%) | 1 (3%) | 34 (100%) |
| FE | 22 (65%) | 10 (29%) | 2 (6%) | 0 | 0 | 34 (100%) |
| Software Development Environments - Deployed | ||||||
| 0 | 1 | 2 | 3 | 4 | Total | |
| HE | 7 (21%) | 15 (44%) | 9 (26%) | 3 (9%) | 0 | 34 (100%) |
| FE | 21 (62%) | 11 (32%) | 2 (6%) | 0 | 0 | 34 (100%) |
| Software Development Environments - Planned | ||||||
| HE | 15 (44%) | 10 (29%) | 6 (18%) | 3 (9%) | 0 | 34 (100%) |
| FE | 23 (68%) | 8 (24%) | 3 (9%) | 0 | 0 | 34 (100%) |
Note: Highest values for each group are in bold. Two highest values are bolded when within 10%.
These results give a finer-grained picture of how OSS is being deployed. As expected, current and planned deployment is most significant for networking systems and operating systems (most likely on servers running the networks). In all other areas, the preponderance of respondents reported only casual use by individuals on an occasional basis, or no deployment at all.
These results confirm the divide that was seen at the more general level—HE institutions are generally deploying more OSS than FE institutions, or are more likely to have plans to do so. This is particularly true for applications which are less well known, such as specialised application packages for subject-based communities, and software development environments.
It may be the case that FE institutions have less of a need for such packages in general, and this would not necessarily be captured in the survey responses. However, one FE interviewee noted that in the area of hotel management—a course offered by his college—all packages used in the real world were proprietary, and so the FE institution had no choice in which software to use for training. This phenomenon may be more widespread among FEs than HEs (which are less vocational) but further investigation is required.
Survey respondents were also asked to indicate whether they were aware of or had deployed various leading OSS packages. The results (Table 13) show that while awareness is generally high for most packages, deployment varies widely.
| GNU / Linux | OpenOffice.org | Mozilla / Konqueror | ||||
| Aware | Deployed | Aware | Deployed | Aware | Deployed | |
| HE | 31 (91%) | 26 (76%) | 28 (82%) | 13 (38%) | 28 (82%) | 15 (44%) |
| FE | 30 (88%) | 19 (56%) | 23 (68%) | 8 (24%) | 24 (71%) | 11 (32%) |
| Evolution | Octave | LaTeX | ||||
| Aware | Deployed | Aware | Deployed | Aware | Deployed | |
| HE | 22 (65%) | 4 (12%) | 10 (29%) | 4 (12%) | 23 (68%) | 14 (41%) |
| FE | 12 (35%) | 2 (6%) | 4 (12%) | 0 | 8 (24%) | 1 (3%) |
| MySQL / PostgreSQL | Apache | Samba | ||||
| Aware | Deployed | Aware | Deployed | Aware | Deployed | |
| HE | 30 (88%) | 22 (65%) | 30 (88%) | 26 (76%) | 28 (82%) | 19 (56%) |
| FE | 27 (79%) | 15 (44%) | 31 (91%) | 21 (62%) | 24 (71%) | 9 (26%) |
| Gaim | VI/Emacs | |||||
| Aware | Deployed | Aware | Deployed | |||
| HE | 14 (41%) | 1 (3%) | 23 (68%) | 20 (59%) | ||
| FE | 7 (21%) | 0 | 12 (35%) | 7 (21%) | ||
Note: Highest values for each group are in bold. Two highest values are bolded when within 10%.
These results also show a significant gap between HEs and FEs. Out of 11 programs, a majority of HE respondents were aware of nine and had deployed five. A majority of FE respondents were aware of seven, and had deployed two. The average rate of deployment was 44% for HE respondents, and 25% for FE respondents. The average rate of awareness was 71% for HE respondents and 54% for FE respondents. However, awareness rates were generally low for some of the less well-publicized OSS packages, such as Gaim and Octave.
From these results it is reasonable to conclude that the deployment rates of most packages are not significantly affected by a lack of awareness of OSS at the HE level. A more detailed outline of why OSS is or is not deployed is given in the next two sections.
Again, it is important to bear in mind that awareness and deployment will vary by department, even in smaller institutions. One interviewee who manages the academic computing department of an FE institution that mainly used proprietary solutions said, All of our computers that are under our direct control have loads of OSS. If OSS disappeared tomorrow, At least two of our modules would be unable to run. We’d have to get some money. It would be a huge problem.
Recommendations 3.7 – 3.8
- Given the relatively low levels of OSS awareness among FE respondents, information and education programmes should be offered for these stakeholders.
- Given that awareness of packages off the beaten path is relatively low for both HE and FE institutions, information should be provided on lesser-known or more specialised OSS packages relevant to stakeholder needs.
Reasons for choosing OSS
The survey included a list of possible benefits of using OSS and asked respondents to choose the one that best described their main reason for using OSS packages over proprietary analogues. The answer choices were based on the Australian survey, which was in turn based on the FLOSS survey.
| TCO | Able to modify | Better support | Less reliant on 1 vendor | interoperability & open standards | Other | Total | |
| HE | 8 (25%) | 6 (19%) | 3 (9%) | 5 (16%) | 9 (28.1%) | 1 (3.1%) | 32 (100%) |
| FE | 16 (53%) | 3 (10%) | 0 | 4 (13%) | 3 (10%) | 4 (13.3%) | 30 (100%) |
| ALL | 24 (38.7%) | 9 (14.5%) | 3 (4.8%) | 9 (14.5%) | 12 (19.4%) | 5 (8.1%) | 62 (100%) |
Note: Highest values for each group are in bold.
The most popular reason (28.1%) HE respondents gave for choosing OSS packages over proprietary analogues was interoperability due to open standards. This benefit was also expressed in site visits, as in the case of one HE interviewee who said,
There is a range of opinion in the university, with some clear anti-Microsoft feeling, and some parts of the university with a predilection to proprietary solutions. What, in my opinion, is most important are the issues of interoperability, and so open standards are a fundamental requirement in order that we have a holistic and integrated IT environment.
Savings on Total Cost of Ownership (TCO) was close behind (25%).
However, a majority of FE respondents (53%) said that savings on TCO was their most important reason for choosing OSS. Interestingly, interoperability was not as important a reason for FE respondents.
Interviewees from HE and FE noted that the marginal savings in licensing costs for implementing OSS desktop operating systems or office applications on their campuses would be zero because of campus-wide licensing agreements with Microsoft. Any TCO savings from OSS would therefore come mainly from reductions in maintenance costs.
Fewer respondents than might be expected cited less reliance on one vendor as a main reason for choosing OSS.
It would have been interesting to get an idea of how much institutions believed they were saving by using OSS, or how much they spent on TCO for OSS, but there was a high non-response to the questions on this subject.25 Given that few respondents knew even rough figures suggests that institutions probably have not carried out comprehensive studies of TCO, and the answer to this question is based largely on informal perception.
Recommendation 3.9
- A study comparing the TCO for OSS and proprietary solutions in UK HE and FE institutions should be carried out. Even a study done on a relatively small scale would significantly contribute to the small body of knowledge on this issue.
Concerns for OSS
| Legal, incl. licensing | Interoperability & migration concerns | ID, categ., availability of software | How to manage project dvlpmt. | OSS take-up elsewhere | 3rd party support | Training | |
| HE | 6 (18%) | 20 (59%) | 10 (29%) | 9 (26%) | 6 (18%) | 11 (32%) | 2 (6%) |
| FE | 9 (27%) | 18 (53%) | 10 (30%) | 6 (18%) | 6 (18%) | 14 (41%) | 3 (9%) |
| ALL | 15 (22%) | 38 (56%) | 20 (29%) | 15 (22%) | 12 (18%) | 25 (37%) | 5 (7%) |
Note: Training was not a choice in the original survey, but was added based on responses in Details/Comments. Highest values for each group are in bold.
The greatest concern among those considering the deployment of OSS was interoperability and migration concerns (56% of respondents). This is somewhat puzzling in the case of HE, given that interoperability was the top reason cited for adopting OSS. This paradox could indicate any number of things—that those who adopted OSS for this reason were operating under false beliefs; that those who are concerned about interoperability do not have full information about OSS applications; or that in some application areas interoperability is a concern, while in others it is not. Another possible reason is that in this question interoperability is was with migration concerns, whereas in the earlier question it stood alone—some respondents may be concerned with migration issues (e.g. training costs, staff expertise, etc.) but not with interoperability. The real reason probably encompasses some element of all these possibilities.
One FE interviewee described how interoperability and migration concerns outweighed TCO savings:
It costs £18,000 a year to license our standard desktop provision, college-wide (including OS and office suite), for 1200 PC’s. If OSS let us do that for £5,000, i could make £13,000 in savings. But in terms of budget percentage overall that’s not that significant compared to problems we might have in terms of support, integration, user familiarity. It’s just a huge huge risk for us to consider moving away.
On the other hand, if the licensing jumped to £30,000 a year and an OSS company said we could do it for £5,000 or less, then it becomes a much greater possibility. The problem is chiefly a historic investment that mainly the users have got, and the familiarity they’ve got…. We change the icon on the desktop here and the user is confused…. So there has to be a serious business justification.
Legal issues, including licensing, third-party support, and the identification, categorisation, and availability of relevant software are also significant for all cohorts. On the issue of identifying relevant software, one interviewee said,
Any kind of searchable information resource categorised by software type and backed up with data on existing users, documentation, support available–that kind of thing would be absolutely brilliant. Our method now for finding software is a bit of hit and miss.
An additional concern cited by three interviewees was that someone in the institution would get nervous about their current use of OSS and make a rash or uninformed decision about its use. One interviewee, who was clearly a supporter of OSS, worried that, someone senior is going to decide it’s a bad idea. That we’re running a bunch of software that doesn’t have formal support…. The reason people are concerned is because of fear, uncertainty, and doubt spread in reputable media.
Interestingly, both HE and FE respondents generally identified the same concerns.
Recommendations 3.10 – 3.14
- A generic assessment of the long-, medium- and short-term risks of OSS implementation for particular applications in terms of each major concern cited should be provided to stakeholders.
- Given the prominence of interoperability as a reason for choosing OSS and as a main concern, information should be provided to FEs and HEs on the relative merits of OSS in terms of interoperability. Case studies from institutions that have chosen OSS for this reason could provide an additional source of information.
- Given the concerns with migration, particularly on desktop systems, best practices in this area should be investigated and a realistic assessment of migration costs should be offered to stakeholders.
- Given the prevalent concern with the identification, categorisation and availability of software, the community might consider an online index of academic software titles for HE and FE institutions. Such an index could also address concerns for particular applications, e.g. third party support, take-up elsewhere, etc.
- Informational resources could be provided to help management of HE and FE institutions contextualise the flood of media reports on the various controversies surrounding OSS, with a view towards supporting clear-headed and rational decisions about the risks of deploying OSS.
IT Development
The FLOSS and Australian survey probed the attitudes of OSS developers, and the prevalence of OSS developers within tertiary education institutions. However information on licensing policies within UK HEs and FEs is scarce. The OSS Watch survey asked respondents about this aspect of their IT policy (see Table 16), and findings were supplemented with site visit interviews.
| Considered, decided against OSS | Never considered, no institutional policy | Release for free, don't want to rock boat by checking legality | Have sorted out legal issues and license programs according to... | Total | |
| HE | 3 (17%) | 9 (50%) | 3 (17%) | 3 (17%) | 18 (100%) |
| FE | 2 (22%) | 7 (78%) | 0 | 0 | 9 (100%) |
| ALL | 5 (19%) | 16 (59%) | 3 (11%) | 3 (11%) | 27 (100%) |
Note: This table only describes results for respondents who also said that their institution develops software in-house. Highest values for each group are in bold.
Relatively few survey respondents develop significant quantities of software in-house, but the majority of institutions that do have never considered the issue of licensing software, and have no institutional licensing policy. Only 11% of responding institutions, or sections within them, have sorted out the legal issues surrounding software licensing according to a particular license.
The survey results also revealed the majority of institutions involved in development never solicit legal advice, and that there were no institutions that almost always sought legal advice.
This finding is consistent with interviews conducted with developers and their managers, in which it was clear that most software licenses were determined by the program’s creator, with very little oversight or institutional forethought. One high-level manager said, At my level there’s no policy. At a technical level it’s done very much on an individual basis.
On the other hand, developers reported that funding bodies often specify that source code be released into the public domain.
For projects that are not subject to funder restrictions, individuals seem typically to rely on fellow developers for advice, and on knowledge they acquire through informally trawling websites such as the Free Software Foundation’s site. One developer recounted,
Someone at Caltech wanted a mail threading program and I gave it to them under GPL myself. I put the GPL license on the top of the files, I made a note of what the copyright of the package was, and who the authors were and so forth, and put the big GPL copyright file in the directory. Whether I actually have the right to grant the GPL license on something I’ve done on work time is questionable. But I would say that as a system programmer I wasn’t overstating my authority and I was confident that no one in my management chain would have a problem with it.
Many developers were concerned that the office of the university responsible for exploiting intellectual property to in commercial sector was unfamiliar with the details of OSS licenses and their implications for commercialization. Advice from this office against incorporating viral code into academic projects that could be commercialised was typically not taken seriously. One interviewee said he was reluctant to seek advice from the enterprise office because, To be honest I don’t think this guy understands the technical issues. From the other side, an interviewee responsible for commercialization said,
Open source makes my job more difficult… We went through a phase six months ago of being very down on it. Recently we’ve seen it as good for bringing things to market. There was a stage we were saying to developers don’t use GPL’d code, write everything from scratch. But then you realise how complicated this stuff is… What if we have blockbuster that is GPL’d?… If we have already GPL’d, then I don’t know what to do. … For me, the thing that would be extremely useful would be networking on how you build software companies around this issue…. What are people doing out there. Are people selling code? Are people just not selling code any more? I would love to know more about those companies that are going out there and what those business models look like, and I could roll back those models into here.
Recommendation 3.15 – 3.18
- Given recent concerns over the commercialization of intellectual property generated in the education sector, and in light of the government’s recent consideration of a default licensing policy for R&D software, it is important that institutions at least consider an institutional licensing policy. Institutions should be encouraged to examine the available options, and provide information and guidance on the possible routes, with particular attention given to the implications of OSS licensing for commercial exploitation.
- JISC might consider making available a set of best practices for licensing software developed in-house. This could include boilerplate copyrights and licenses.
- Cases of universities successfully commercializing source code protected under OSS licenses should be investigated and made available to developers and university enterprise offices.
- More generally, JISC might consider making contact with university enterprise offices that are struggling to make sense of OSS and determine what services might be useful to them.
Sources of Info on OSS
One concern of OSS Watch’s is how best to communicate information to stakeholders. Two survey questions addressed sources of information on OSS—one in the Scoping Survey (Table 17) and another in the mini-survey posted on OSS Watch’s website for a number of months. (Table 18).
| Source | Number |
| websites, e-mail lists | 34 |
| Newsgroups | 2 |
| Printed sources | 15 |
| Community, word of mouth | 11 |
| Other | 6 |
Note: These categories are drawn from comments given in response to an open-ended question. More than one source could be cited. N=53.
Please select one or more participatory services you would like OSS Watch to offer:
| Website | 174 |
| Sessions in existing conferences | 98 |
| OSS Watch conferences | 92 |
| RSS news feed | 73 |
| OSS Watch announce list | 135 |
| Blogging on our website | 55 |
| Unmoderated discussion list | 80 |
| Site visits | 36 |
N=217
Unsurprisingly, the majority of respondents receive their information on OSS via the web and e-mail lists. Respondents to the mini-survey overwhelmingly endorsed an OSS Watch website and announce list. Respondents also expressed a strong interest in sessions at existing and OSS Watch conferences.
Recommendation 3.19
- Although sole use of the web and e-mail is probably not an optimal means of soliciting feedback from HE and FE stakeholders, respondents’ habit of receiving info on OSS via the web and e-mail suggests that this is an effective means of distributing information. Building a database of relevant contacts (see above) will aid information distribution.
Stakeholder outlook on OSS Watch Service
The mini-survey self-administered by visitors signing up for the OSS Watch e-mail list directly asked respondents for their opinions on how OSS Watch should focus its services.
| Licensing | 89 |
| Best practice for developers | 110 |
| End user desktop solutions | 128 |
| Social impact of open source | 81 |
| Institutional benefits of open source | 148 |
| Fitting open source into the software acquisition process | 109 |
| Connection between open source and open standards | 114 |
N=217
Mini-survey respondents were also interested in learning more about the institutional benefits of open source, interoperability (the connection between open source and open standards), and end-user desktop solutions (presumably this reflects a concern with TCO). These responses are consistent with many of the conclusions drawn above.
Interviewees often suggested that OSS Watch should provide case studies or best practices drawn from other institutions’ experiences. One said,
We would like to know if other institutions have successfully rolled out major OSS applications in key roles. For example, if anybody has rolled out an OSS database as a central database. When we decided to use Microsoft SQL there wasn’t an open source option at that level. We’re not likely to change but I would like to know if there’s something out there.
Scoping Survey Questions (with data codes)
Coding Notation
[z,s]QX.y
z = Type of answer. c = check box; r = radio button; t = text box
s = Size of text field if not default of 50 characters.
X = Question number
y = Answer possibility
- Variable names in the data file are QX.
- Unless otherwise noted, the default value for ticked check boxes is 1 . An unticked box returns a value of 0 . [In early versions of the data file, a ticked box returned a value of ‘yes’, an unticked box a null value.]
- The value of radio button answer choices is indicated by the = sign.
- Unless otherwise noted, the default length of text boxes is 50 characters.
Missing Data Key
6666 = Respondent not required to answer question
7777 = Answer not clear
8888 = Respondent said they did not know or did not have an opinion
9999 = Answer not given, reason unknown
(session id=session )
Introduction
OSS Watch is a new pilot advisory service on free and open source software. It is a national service for UK higher and further education based within the Research Technologies Service at the University of Oxford. OSS Watch aims to inform and advise about open source software and open standards through the development of best-practice guidelines, and out-reach activities aimed at OSS strategic planners, developers and users.
In an effort to determine how best to develop this service OSS Watch is conducting a scoping study of UK HE and FE institutions. Our goal is to investigate the current state of participation in free and open source software both in terms of projects developing such software and of institutional deployment of such software.
We have sent this survey to IT Directors/Managers at each further and higher education institute in the UK. The value of the study depends upon each respondent completing the full set of questions. Please be sure to select an answer for each question or sub-question. The survey should not take longer than 20 minutes to complete.
This survey asks for factual information about IT use at your institution, and should ideally be filled out by someone who is familiar with IT across the institution. If you are only familiar with a particular department or school, please indicate that in the appropriate space below. Data from the survey will be anonymized in the report, and the report will be made public.
OSS Watch is funded by the Joint Information Systems Committee (JISC) and is managed by Sebastian Rahtz. For further information about OSS Watch please visit http://www.oss-watch.ac.uk/or contact OSS Watch at info@oss-watch.ac.uk
Thank you for helping OSS Watch to develop into a useful service for UK HE and FE.
If you would like to receive an electronic copy of the survey results and accompanying analysis, please tick this box.
[c]Q0.1
I. Information on the individual filling out the survey (1 of 12)
[t]Q1.1Name
[t]Q2.1Email* (this field is mandatory)
[t]Q3.1Phone
[t]Q4.1Work Address 1
[t]Q4.2Work Address 2
[t]Q4.3Work Address 3
[t]Q4.4Work Address 4
[t]Q4.5Work Address Postcode
[r](Q5.1Please select the option that best describes your answers on this survey
=1)- Speaking for the whole institution
=2)- Speaking for a section of the institution
[t]Q6.1If you are responding for a section of your institution, please identify which department.
[c]Q7.1Please tick all boxes which describe your job responsibilities
.1- Short-term software procurement
.2- Medium-term software procurement
.3- Long-term software procurement
.4 - Training
.5- Software development
.6- Distribution licence design or approval for software developed in-house
II. Description of institution (2 of 12)
[r](Q8.1Type of institution
=1)- Higher Education
=2)- Further Education
[t]Q9.1Name of institution
In what follows, the term “organisation” is used for the entity for which you are providing responses. If you are able to respond on behalf of the whole institution, please do so, even if you have to make rough estimates.
[t,10]Q10.1Approximate number of students that your organisation serves (undergraduate and graduate)
[t,10]Q11.1Approximate number of academic and academic-related staff that your organisation serves
[t,10]Q12.1Approximate number of other staff that your organisation serves
[t,10]Q13.1Approximate number of separate desktop computers that your organisation provides software and software support for:
[t,10]Q13.2Approximate number of separate servers that your organisation provides software and software support for:
Please feel free to ignore questions 14 and 15 if you feel that you do not have the information or are unwilling to provide it.
[t,10]Q14.1Approximate annual software license budget of your organisation for 2002-2003
[t,10]Q15.1Approximate annual software support budget (development, training, etc.) of your organisation for 2002-2003
III. IT strategy questions (3 of 12)
For these questions, Open Source Software is defined as software which is released under one of the OSI approved licenses. These include, but are not limited to GPL, LGPL, BSD, MIT, Mozilla Public License, Apache Software License, Sun Public License, Academic Free License. For a more complete list, see http://www.opensource.org/licenses/index.html.
You can add further details in the Details/Comment box at the end of each question, if you feel your responses need explanation or qualification. These are complex issues and additional information will add value to the survey.
In what follows, the term “organisation” is used for the entity for which you are providing responses. If you are able to respond on behalf of the whole institution, please do so, even if you have to make rough estimates.
[r](Q16.1Does your organisation have an IT policy or strategy that addresses whether to examine OSS as an option when procuring software?
=1)- Our organisation has no IT policy/strategy
=2)- Our organisation has an IT policy/strategy, but OSS is not mentioned
=3)- Our organisation has an IT policy/strategy of not using OSS software
=4)- Our organisation has an IT policy/strategy that explicitly considers OSS as
an option
=5)- Our organisation has an IT policy/strategy in which OSS is the preferred
option
=6)- Our organisation has an IT policy/strategy in which OSS is the only option
[t,3*50]Q16.2Details or Comments _______
III. IT strategy questions (4 of 12)
[r](Q17.1What is your organisation’s average level of awareness of Open Source Software?
=1)- Very few are more than slightly aware of open source concepts
=2)- Open source software has been looked into by quite a number of people, or by a few in some depth, but in general further information is needed before deploying
=3)- Open source has been investigated and decisions have been made on
deployment
[t,3*50]Q17.2Details or Comments _______
[r](Q18.1What is your organisation’s overall level of skill with open source software? This question is concerned with skill in using and administering open source software packages and software and not with the open source software development process
=1)- There are very few with these skills
=2) - A moderate number of staff are skilled with at least one open source software package
=3)- Significant numbers of staff are skilled with more than one open source software package
[t,3*50]Q18.2Details or Comments _______
III. IT strategy questions (5 of 12)
[r](Q.19.1What is your organisation’s overall level of skill with the open source software development process? This question is concerned with familiarity with how open source software is developed, where to go for support, how bugs are fixed, etc.
=1)- There are very few with these development skills
=2)- A moderate number of staff are somewhat familiar with the OSS development process
=3)- Significant numbers of staff are skilled with the entire open source software development process
[t,3*50]Q19.2Details or Comments _______
[r](Q20.1Have you deployed, or do you intend to deploy, open source software in a significant way within your organisation? If so, what time frame do you have for deployment?
=1)- Decided not to deploy open source software
=2)- Have already deployed open source software but in a rather limited way
=3)- Have already deployed open source software in significant ways/quantities
=4)- Deploying open source software this year
=5)- Deploying open source software within years
=6)- No decision made yet
[t,3*50]Q20.2Details or Comments _______
III. IT strategy questions (6 of 12)
Q21 If your organisation has already deployed open source software, in which areas has it been deployed? Please select the best description of your institution’s involvement with this software on a scale of 1 to 4
0 = Not deployed (added after survey administered and substituted for null answers)
1 = Casual use of OSS by individuals on an occasional basis
2 = Organisation reliant on certain OSS products, but no involvement in development
3 = Organisation reliant on certain OSS products, and occasional contributor to their
development
4 = Organisation is mainstream OSS developer
Legend
| \[r\]Q21.1 | Operating Systems | 1 2 3 4 |
| \[r\]Q21.2 | Networking systems (DNS servers, web servers, email services, firewalls, etc. | 1 2 3 4 |
| \[r\]Q21.3 | Information systems (portal frameworks, Virtual Learning Environments (VLE), content management systems (CMS), library management systems,digital repositories/archives) | 1 2 3 4 |
| \[r\]Q21.4 | General-purpose user desktop systems (e.g., office productivity, multimedia tools, email and web clients, statistical packages, databases), web applications, and web services | 1 2 3 4 |
| \[r\]Q21.5 | Specialised application packages for subject-based communities (e.g. archaeological statistics programs, zoological databases) | 1 2 3 4 |
| \[r\]Q21.6 | Software development environments | 1 2 3 4 |
| \[r\]Q21.7 | [t,50]Q21.7.0 Other... | 1 2 3 4 |
[t,3*50]Q21.8 Details or Comments _______
III. IT strategy questions (7 of 12)
Q22 If your organisation has plans to deploy open source software in the future, in which areas will it be deployed? Please select your the best description of your institution’s anticipated involvement with this software on a scale of 1 to 4.
0 = Not deployed (added after survey administered and substituted for null answers)
1 = Casual use of OSS by individuals on an occasional basis
2 = Organisation reliant on certain OSS products, but no involvement in development
3 = Organisation reliant on certain OSS products, and occasional contributor to their development
4 = Organisation is mainstream OSS developer
| \[r\]Q22.1 | Operating Systems | 1 2 3 4 |
| \[r\]Q22.2 | Networking systems (DNS servers, web servers, email services, firewalls, etc. | 1 2 3 4 |
| \[r\]Q22.3 | Information systems (portal frameworks, Virtual Learning Environments (VLE), content management systems (CMS), library management systems,digital repositories/archives) | 1 2 3 4 |
| \[r\]Q22.4 | General-purpose user desktop systems (e.g., office productivity, multimedia tools, email and web clients, statistical packages, databases), web applications, and web services | 1 2 3 4 |
| \[r\]Q22.5 | Specialised application packages for subject-based communities (e.g. archaeological statistics programs, zoological databases) | 1 2 3 4 |
| \[r\]Q22.6 | Software development environments | 1 2 3 4 |
| \[r\]Q22.7 | [t,50]Q22.7.0 Other... | 1 2 3 4 |
[t,3*50]Q22.8 Details or Comments _______
III. IT strategy questions (8 of 12)
[r](Q23.1If your institution currently has no plans to deploy OSS, would you be open to the idea of using
OSS?
=1)- Yes
=0) –No
=3) – Yes, and have already deployed (added after survey given, for those who answered Yes, and had no
plans, but had already deployed OSS in some form)
[t,3*50]Q23.2Why? _______
[t,3*50]Q23.3 Details or Comments _______
Q24 What proportion of software packages deployed in your organisation is available under an open source license?
[t,10]Q24.2 _____ Percentage of packages deployed
[t,10]Q24.3 _____ Approximate number of copies
III. IT strategy questions (9 of 12)
Q25 The following table is a selection of open source software packages. Please indicate whether you are Aware of or have Deployed each package. Please also indicate the range of use of the application, by ticking all scenarios that apply.
A = Aware
D = Deployed
0 = Not deployed (added after survey administered and substituted for null answers)
1 = Casual use on an individual basis
2 = Used only by advanced technical staff
3 = Used in some subject-based communities
4 = Used across the institution, on all or most cluster computers, staff workstations, etc.
| GNU/Linux (Operating system) | [c]Q25.1.A A | [c]Q25.1.D D | [c]Q25.1.1 1 | [c]Q25.1.2 2 | [c]Q25.1.3 3 | [c]Q25.1.4 4 |
| OpenOffice.org (Office package) | [c]Q25.2.A A | [c]Q25.2.D D | [c]Q25.2.1 1 | [c]Q25.2.2 2 | [c]Q25.2.3 3 | [c]Q25.2.4 4 |
| Mozilla/Konqueror (Web browsers) | [c]Q25.3.A A | [c]Q25.3.D D | [c]Q25.3.1 1 | [c]Q25.3.2 2 | [c]Q25.3.3 3 | [c]Q25.3.4 4 |
| Evolution (Outlook clone) | [c]Q25.4.A A | [c]Q25.4.D D | [c]Q25.4.1 1 | [c]Q25.4.2 2 | [c]Q25.4.3 3 | [c]Q25.4.4 4 |
| Octave (Matlab clone) | [c]Q25.5.A A | [c]Q25.5.D D | [c]Q25.5.1 1 | [c]Q25.5.2 2 | [c]Q25.5.3 3 | [c]Q25.5.4 4 |
| LaTeX (Typesetting language) | [c]Q25.6.A A | [c]Q25.6.D D | [c]Q25.6.1 1 | [c]Q25.6.2 2 | [c]Q25.6.3 3 | [c]Q25.6.4 4 |
| MySQL/PostgreSQL (Database servers) | [c]Q25.7.A A | [c]Q25.7.D D | [c]Q25.7.1 1 | [c]Q25.7.2 2 | [c]Q25.7.3 3 | [c]Q25.7.4 4 |
| Apache (Web server) | [c]Q25.8.A A | [c]Q25.8.D D | [c]Q25.8.1 1 | [c]Q25.8.2 2 | [c]Q25.8.3 3 | [c]Q25.8.4 4 |
| Samba (Windows-compatible file sharing) | [c]Q25.9.A A | [c]Q25.9.D D | [c]Q25.9.1 1 | [c]Q25.9.2 2 | [c]Q25.9.3 3 | [c]Q25.9.4 4 |
| Gaim (Instant messenger client) | [c]Q25.10.A A | [c]Q25.10.D D | [c]Q25.10.1 1 | [c]Q25.10.2 2 | [c]Q25.10.3 3 | [c]Q25.10.4 4 |
| VI/Emacs (Text editors) | [c]Q25.11.A A | [c]Q25.11.D D | [c]Q25.11.1 1 | [c]Q25.11.2 2 | [c]Q25.11.3 3 | [c]Q25.11.4 4 |
| [t]Q25.12.0 Other... | [c]Q25.12.A A | [c]Q25.12.D D | [c]Q25.12.1 1 | [c]Q25.12.2 2 | [c]Q25.12.3 3 | [c]Q25.12.4 4 |
| [t]Q25.13.0 Other... | [c]Q25.13.A A | [c]Q25.13.D D | [c]Q25.13.1 1 | [c]Q25.13.2 2 | [c]Q25.13.3 3 | [c]Q25.13.4 4 |
| [t]Q25.14.0 Other... | [c]Q25.14.A A | [c]Q25.14.D D | [c]Q25.14.1 1 | [c]Q25.14.2 2 | [c]Q25.14.3 3 | [c]Q25.14.4 4 |
[t,3*50]Q25.15Details or Comments _______
[r](Q26.1On the whole, what was the main reason you chose to use these OSS packages over proprietary analogues?
=1)- Saving on Total Cost of Ownership (TCO)
=2)- Able to modify source for specific reason
=3) - Better response with bug fixes and/or support
=4)- Less reliance on a particular vendor
=5)- Better interoperability with other products due to open standards
=6) – Other [Not include as choice in survey, but others were mention in details/comments. ]
[t,3*50]Q26.2Details or Comments _______
III. IT strategy questions (10 of 12)
[t,10]Q27.1What percentage of your budget do you estimate was spent on open source software (including deployment, support and maintenance)? _____
[t,3*50]Q27.2 Details or Comments _______
[c]Q28.1What are your biggest concerns for OSS? (tick all that apply)
.1- Legal issues including licensing
.2- Interoperability and migration concerns
.3- Identification, categorisation and availability of relevant software
.4- How to archive and manage ongoing development of software after projects are finished in-house
.5- Investigation and assessment of open source software take-up in comparable environments around the world
.6- 3rd party support
.7 – Training [This was not in survey, but showed up in a number of details/comments.]
[t,3*50]Q28.2Details or Comments _______
[t][c]Q29.1What is your current source of information on OSS? _____
[Blue categories were added after survey given, based on text answers.]
.1 – websites, e-mail lists
.2 – Newsgroups
.3 – Printed sources
.4 – Community, word of mouth
.5 – Other
[t,3*50]Q29.2Details or Comments _______
IV. IT development questions (11 of 12)
[r](Q30.1Does your institution develop software in-house? (If not, it is only necessary to answer the first question on the page, then press ‘Next’)
=1)Yes
=0)No
[t,3*50]Q30.2Details or Comments _______
[r](Q31.1What best describes your policy on licensing for software you develop in-house?
=1)- Have considered it, and decided against open source
=2)- Have never considered the issue, don’t have an institutional licensing policy
=3)- Put out programs for free, don’t want to rock the boat by checking legality
=4)- Have sorted out legal issues, and have licensed programs according to…
[t,3*50]Q31.2_______ (supply licence details)
[r](Q32.1Do your developers use OSS distribution licenses?
=1)- Almost always
=2)- Sometimes
=3) - Never
[t,3*50]Q32.2Details or Comments _______
[r](Q33.1Do your developers share source code with developers at other institutions?
=1)- Almost always
=2)- Sometimes
=3)- Never
[t,3*50]Q33.2Details or Comments _______
[r](Q34.1Does your organisation solicit legal advice on intellectual property protections related to software developed in-house?
=1)- Almost always
=2)- Sometimes
=3)- Never
[t,3*50]34.2Details or Comments _______
[t,3*50]Q35.1Please write any additional comments or suggestions here:
V. Participation in further study (12 of 12)
[r](Q36.1Would you be willing to be contacted for participation on further research into this subject?
=1)Yes
=0)No
-
Open source software is commonly conflated with free software, but many leaders in the software community argue that this is a mistake and there is an important distinction between the two. The terms Free Software and Open Source Software are used interchangeably in this report, except where a distinction is being made. ↩
-
See Napper, Brian, Computer 50: The University of Manchester Celebrates the Birth of the Modern Computer [World Wide Web]. University of Manchester, 1998. Available from http://www.computer50.org/. ↩
-
See Armer, Paul, ‘SHARE–A Eulogy to Cooperative Effort (1956)’, Annals of the History of Computing, vol. 2, 2 (1980), pp. 122-129; Tannenbaum, David, ‘Open vs. Proprietary Knowledge: The Case of Computer Software, 1955-1990.’ M.Phil, University of Oxford, 2003. ↩
-
Peeling, Nic, and Satchell, Julian, ‘Analysis of the Impact of Open Source Software’. (London, 2001), p. vi. ↩
-
Source: Compiled from Netcraft Web Survey, http://www.netcraft.com. N.B., does not measure Intranet and LAN servers. ↩
-
Wichmann, Thorsten, ‘FLOSS Final Report - Part 1: Use of Open Source Software in Firms and Public Institutions’. (Berlin, 2002), p. 17. ↩
-
Peeling and Satchell, p. 24. ↩
-
See http://directory.google.com/Top/Computers/Consultants/Unix_Systems/Linux/Europe/ ↩
-
Peeling and Satchell, pp. vii, 8, 24. ↩
-
‘Open Source Software Use Within UK Government’. Office of the e-Envoy. (London, 2002). ↩
-
e-Envoy, The use of open source software [World Wide Web]. e-Envoy, July 23, 2002. ↩
-
Thompson, Bill, UK tests open source waters [World Wide Web]. BBC News, October 10 2003. Available from http://news.bbc.co.uk/1/hi/technology/3181108.stm. ↩
-
‘eEurope 2002 Action Plan’, (Brussels, 2000), p. 23. Available from http://europa.eu.int/information_society/eeurope/2002/action_plan/notedf/actionplan_en.pdf. ↩
-
‘eEurope 2005 Action Plan’. (Brussels, 2002), pp. 10-11, 16, 18. Available from http://europa.eu.int/information_society/eeurope/2002/news_library/documents/eeurope2005/eeurope2005_en.pdf. ↩
-
Netproject Ltd, ‘IDA Open Source Migration Guidelines’, (Surrey, 2003), pp. 8, 11. Available from http://europa.eu.int/ISPO/ida/export/files/en/1618.pdf. ↩
-
Reid, Alex, Issues in the Use of Open Source Software - OSS [World Wide Web]. July 4 2003. ↩
-
For example, for questions where respondents could choose more than one answer we would have preferred to ask about each answer choice separately and provide a scale of agreement. ↩
-
See Dowling, Zoe, ‘Web Questionnaire Design: Some Practical Considerations’, Survey Methodology Bulletin, 52 (2003). ↩
-
Wichmann, p. 11. ↩
-
See Dillman, Don A., Mail and internet surveys. 2nd ed (New York ; Chichester, 2000), pp. 324-327. ↩
-
It would have been ideal to offer financial incentives up-front, e.g. £1 in the mail to all potential respondents. However, without a contact list and with a small budget this was virtually impossible. See Warriner, K., Goyder, J., Gjertsen, H., Hohner, P., & McSpurren, K. Charities, no; Lotteries, no; Cash, yes: Main effects and interaction in a Canadian incentives experiment. Public Opinion Quarterly, 60, (1996), 542-562. ↩
-
In some cases, e.g. collegiate institutions, there is arguably no single individual who could answer for the entire institution. However, these cases are few in number and discretion was left up to the respondent, since he/she had better knowledge than we did. ↩
-
For example, see ‘The UK Survey of Library and Learning Resource Provision in Further Education Colleges’, (2003). Available from http://www.cilip.org.uk/practice/fecolleges/fecolleges.pdf. ↩
-
The full anonymised data set and detailed breakdowns of each table in this report are available on request from OSS Watch. Note that because of rounding, percentages may not add up exactly to 100%. ↩
-
The FLOSS survey experienced a similar problem. Wichmann, p. 33. ↩